Cloud Cost
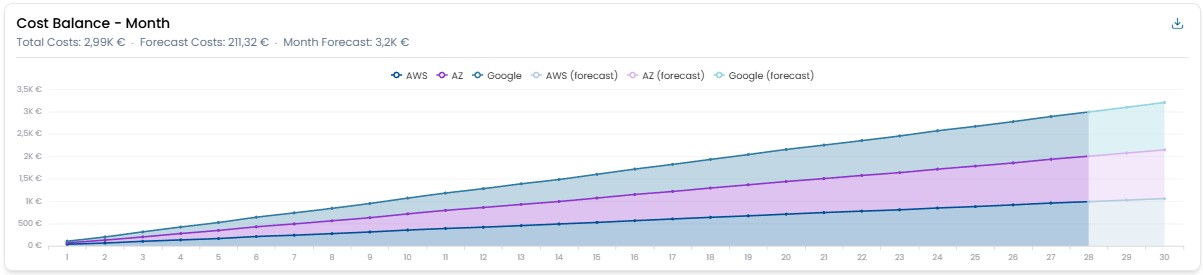
Costs Balance Month
Displays the cumulative trend of daily spending for the selected month, broken down by each cloud provider. If the selected month is the current one, a forecast estimate of spending until the end of the month is also displayed.
There is a button in the top right corner that allows you to download the values displayed in the widget in Excel format.
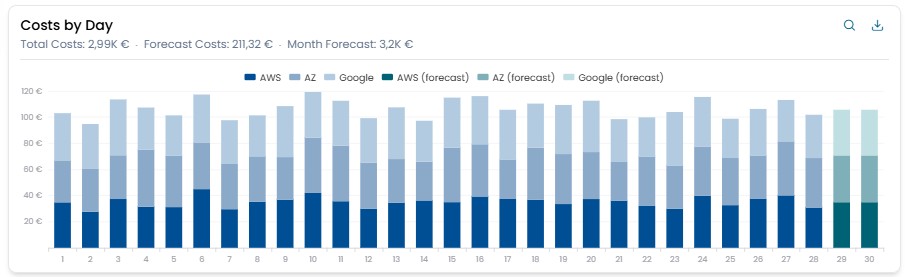
Costs By Day
Shows the daily expenditure for the selected month, detailing the breakdown between the different cloud providers. If the selected month is the current one, an estimate of the projected expenditure until the end of the month is also displayed.
There is a button in the top right corner that allows you to download the values displayed in the widget in Excel format.
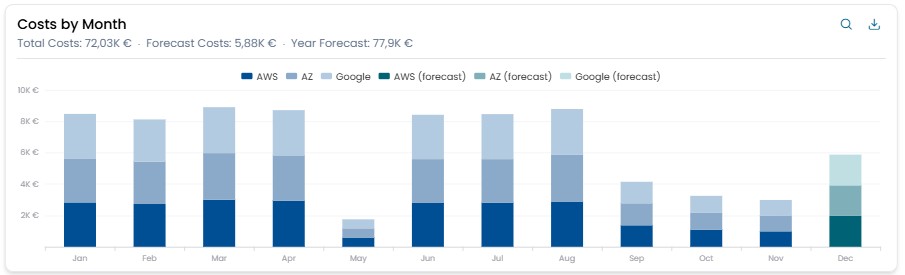
Costs By Month
The monthly spending for the selected year is displayed, broken down by cloud provider. Additionally, a monthly spending forecast is provided until the end of the year.
Clicking on one of the bars that represent the expenses for a single month opens a modal window with the details of the costs incurred during that period.
There is a button in the top right corner that allows you to download the values displayed in the widget in Excel format.
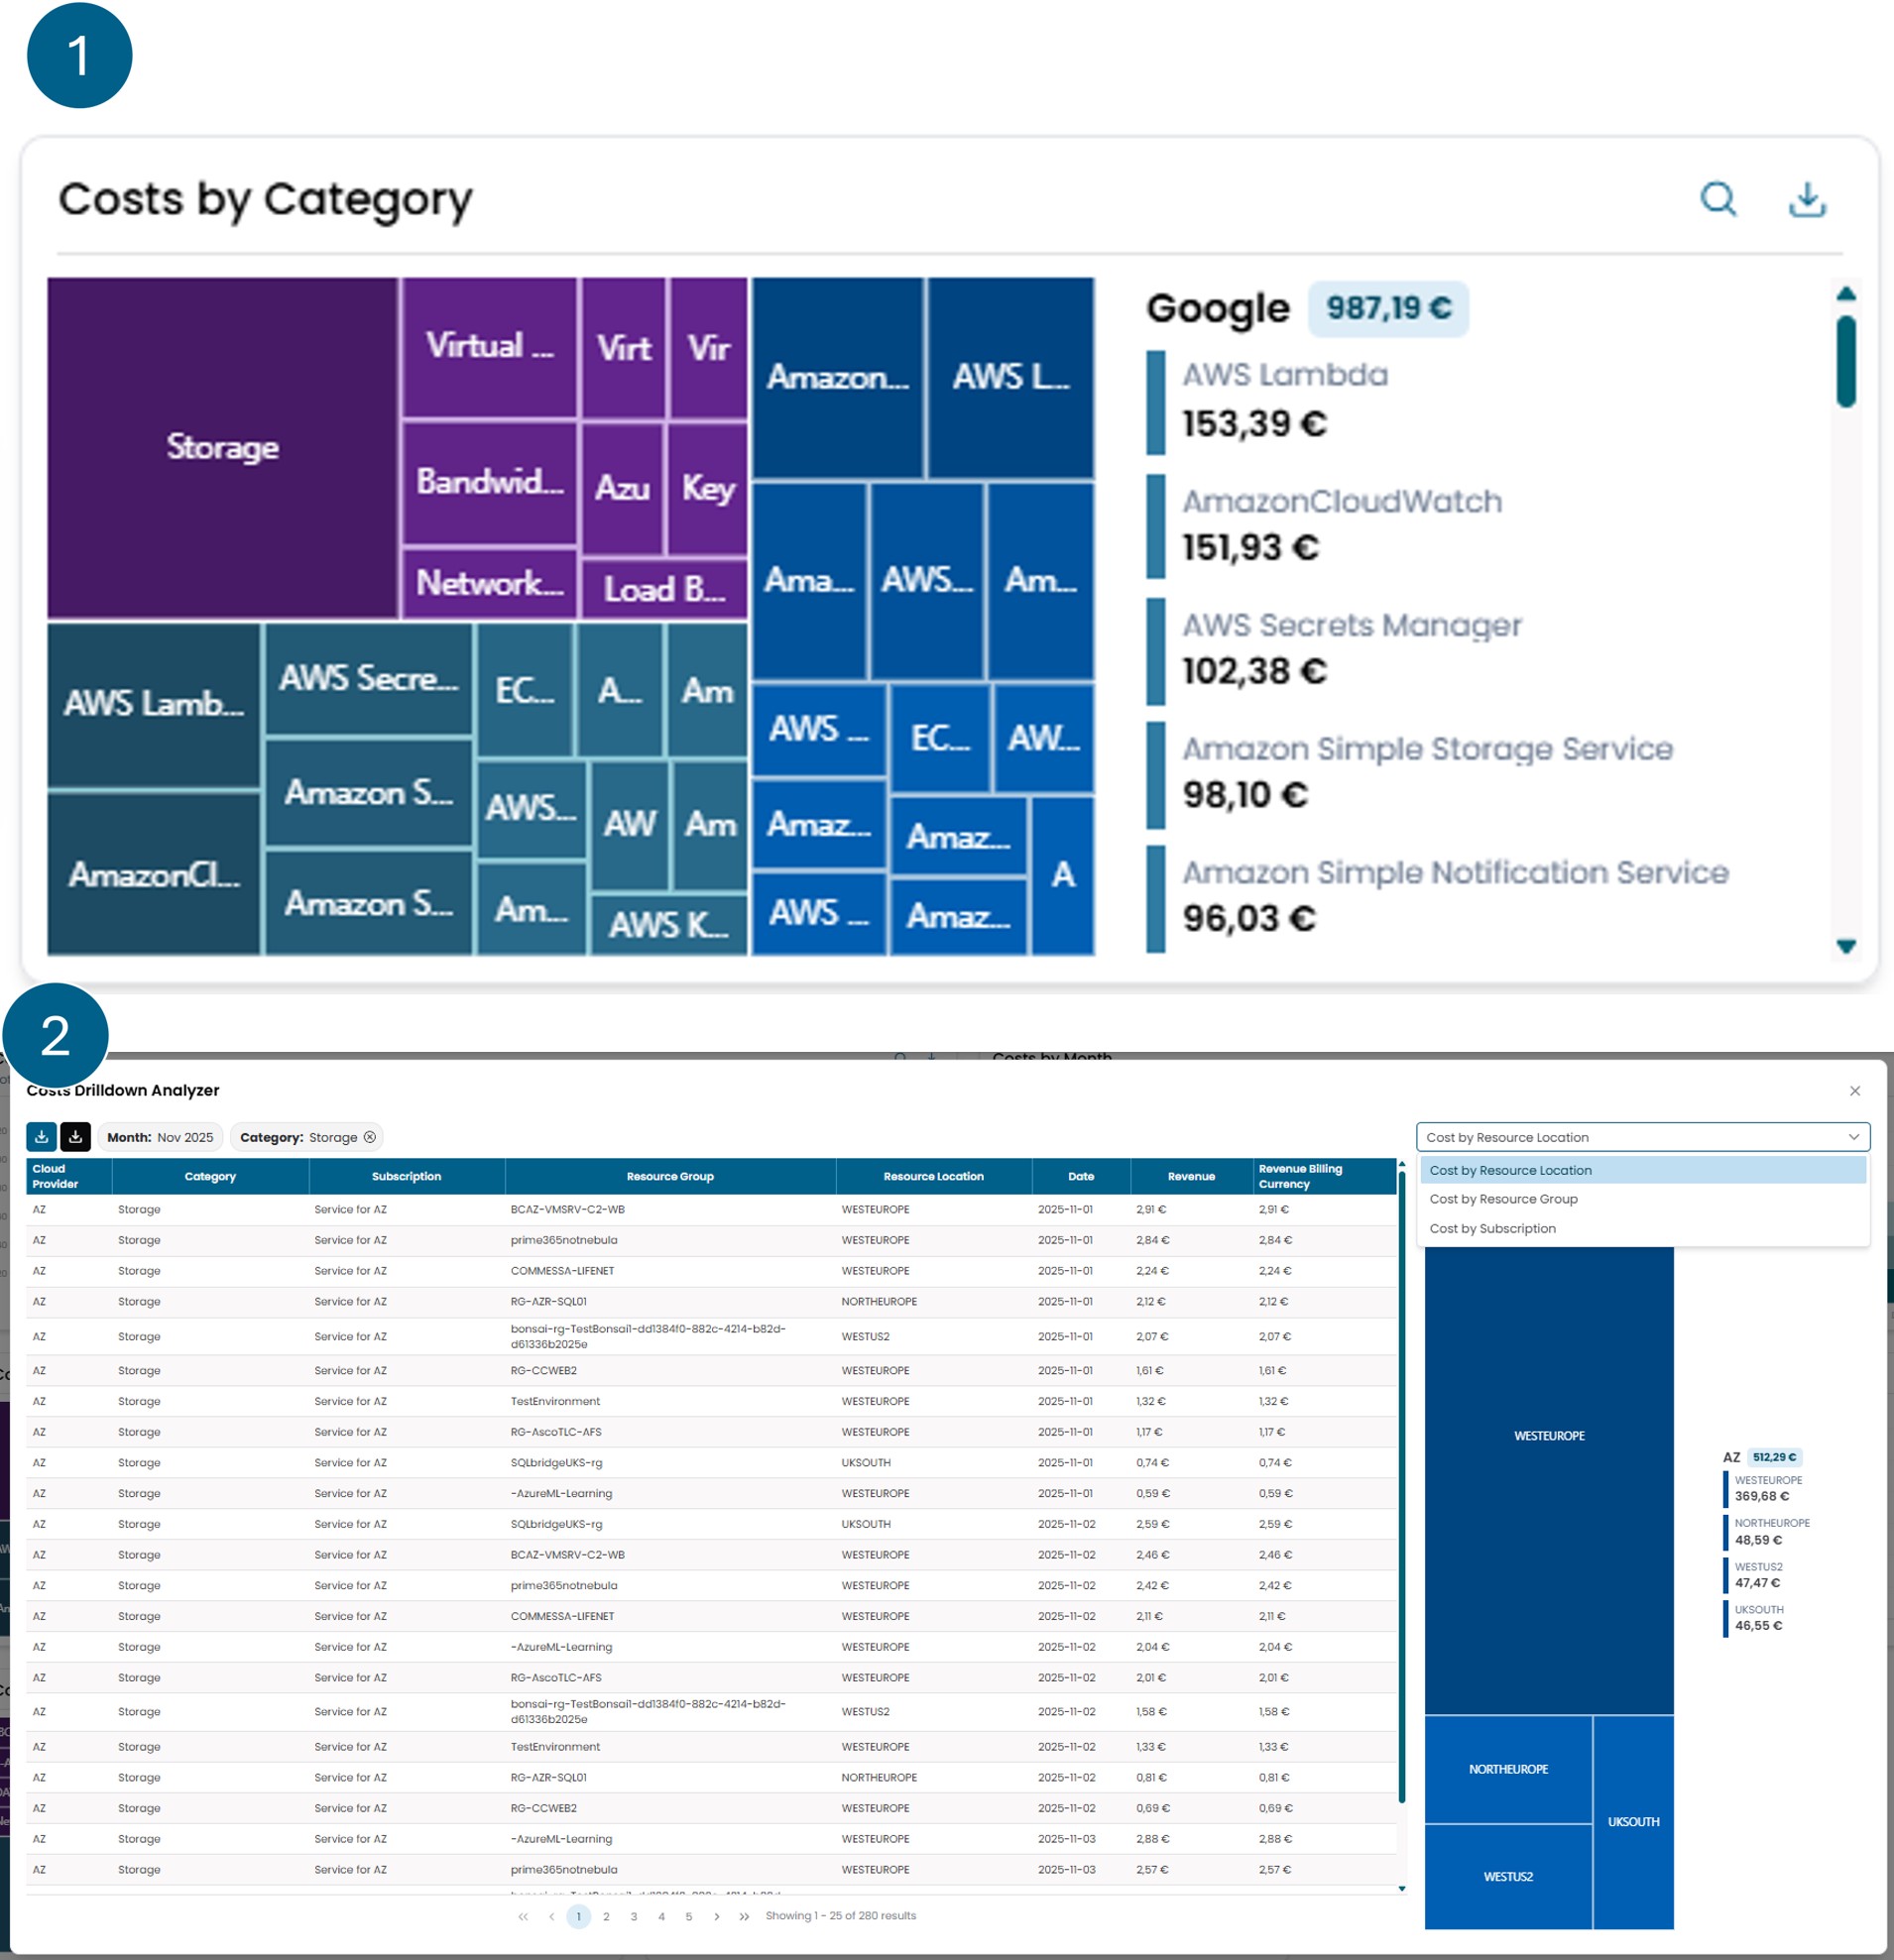
Costs By Category
The widget is divided into two main views.
The first view shows the cloud costs of various providers,
grouped by Category.
On the left is a graphical representation, while on the right
is a breakdown of the expenses.
By clicking on one of the sections of the chart, you access the
second view, where the costs that make up the selected category
are displayed.
From this screen, it is possible to apply further filters:
you can choose a criterion from the dropdown menu in the upper
right corner and then click on the corresponding slice that appears
just below.
This allows for progressively segmenting the cloud costs.
The applied filters can be removed by clicking the cross next to the
filter name, located above the cost table.
Also from this view, it is possible to:
- download the details shown in the cost table using the blue download button, located in the upper left;
- or export the report as provided directly by the cloud provider, with more complete information, using the black button next to the blue one.
There is a button in the top right corner that allows you to download the values displayed in the widget in Excel format.
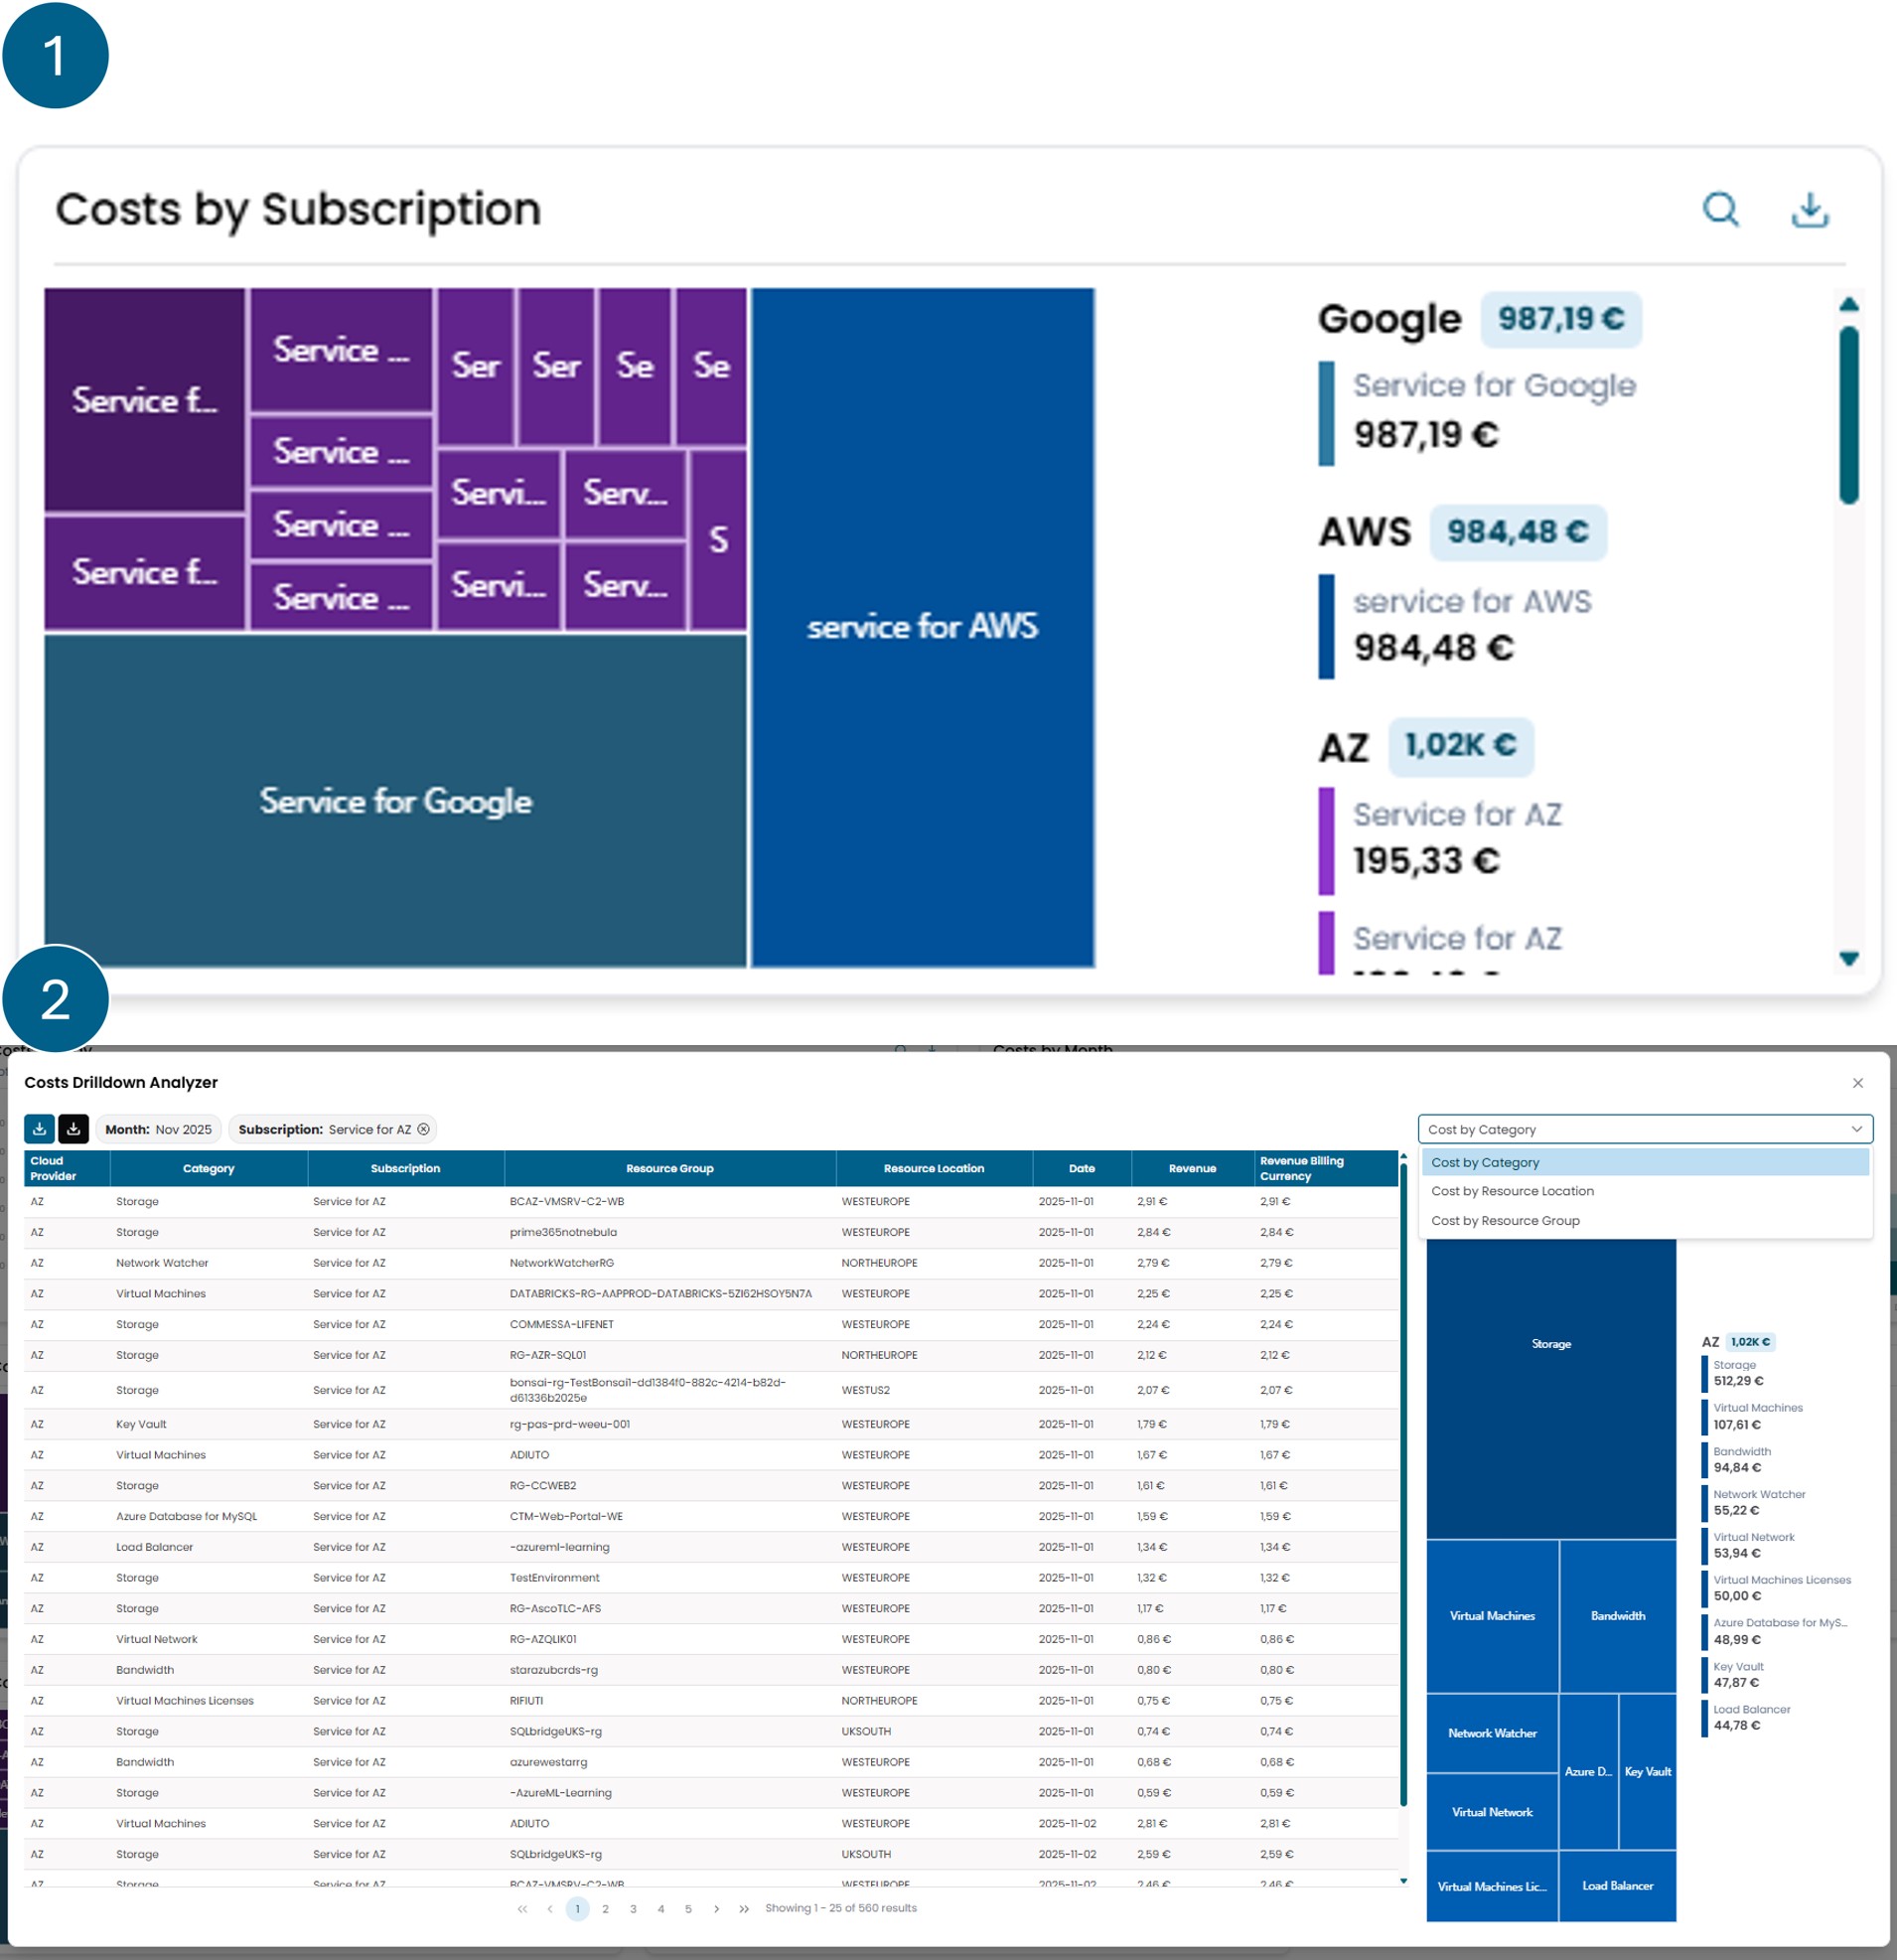
Costs By Subscription
The widget is divided into two main views.
The first view shows the cloud costs of various providers,
grouped by Subscription.
On the left is a graphical representation, while on the right
is a breakdown of the expenses.
By clicking on one of the sections of the chart, you access the
second view, where the costs that make up the selected category
are displayed.
From this screen, it is possible to apply further filters:
you can choose a criterion from the dropdown menu in the upper
right corner and then click on the corresponding slice that appears
just below.
This allows for progressively segmenting the cloud costs.
The applied filters can be removed by clicking the cross next to the
filter name, located above the cost table.
Also from this view, it is possible to:
- download the details shown in the cost table using the blue download button, located in the upper left;
- or export the report as provided directly by the cloud provider, with more complete information, using the black button next to the blue one.
There is a button in the top right corner that allows you to download the values displayed in the widget in Excel format.
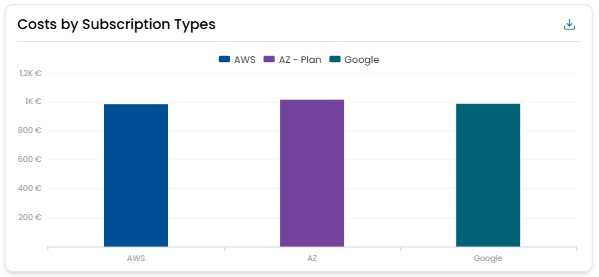
Costs By Subscription Type
This widget shows the breakdown of the total monthly expenditure across the different cloud providers for which a subscription is held.
There is a button in the top right corner that allows you to download the values displayed in the widget in Excel format.
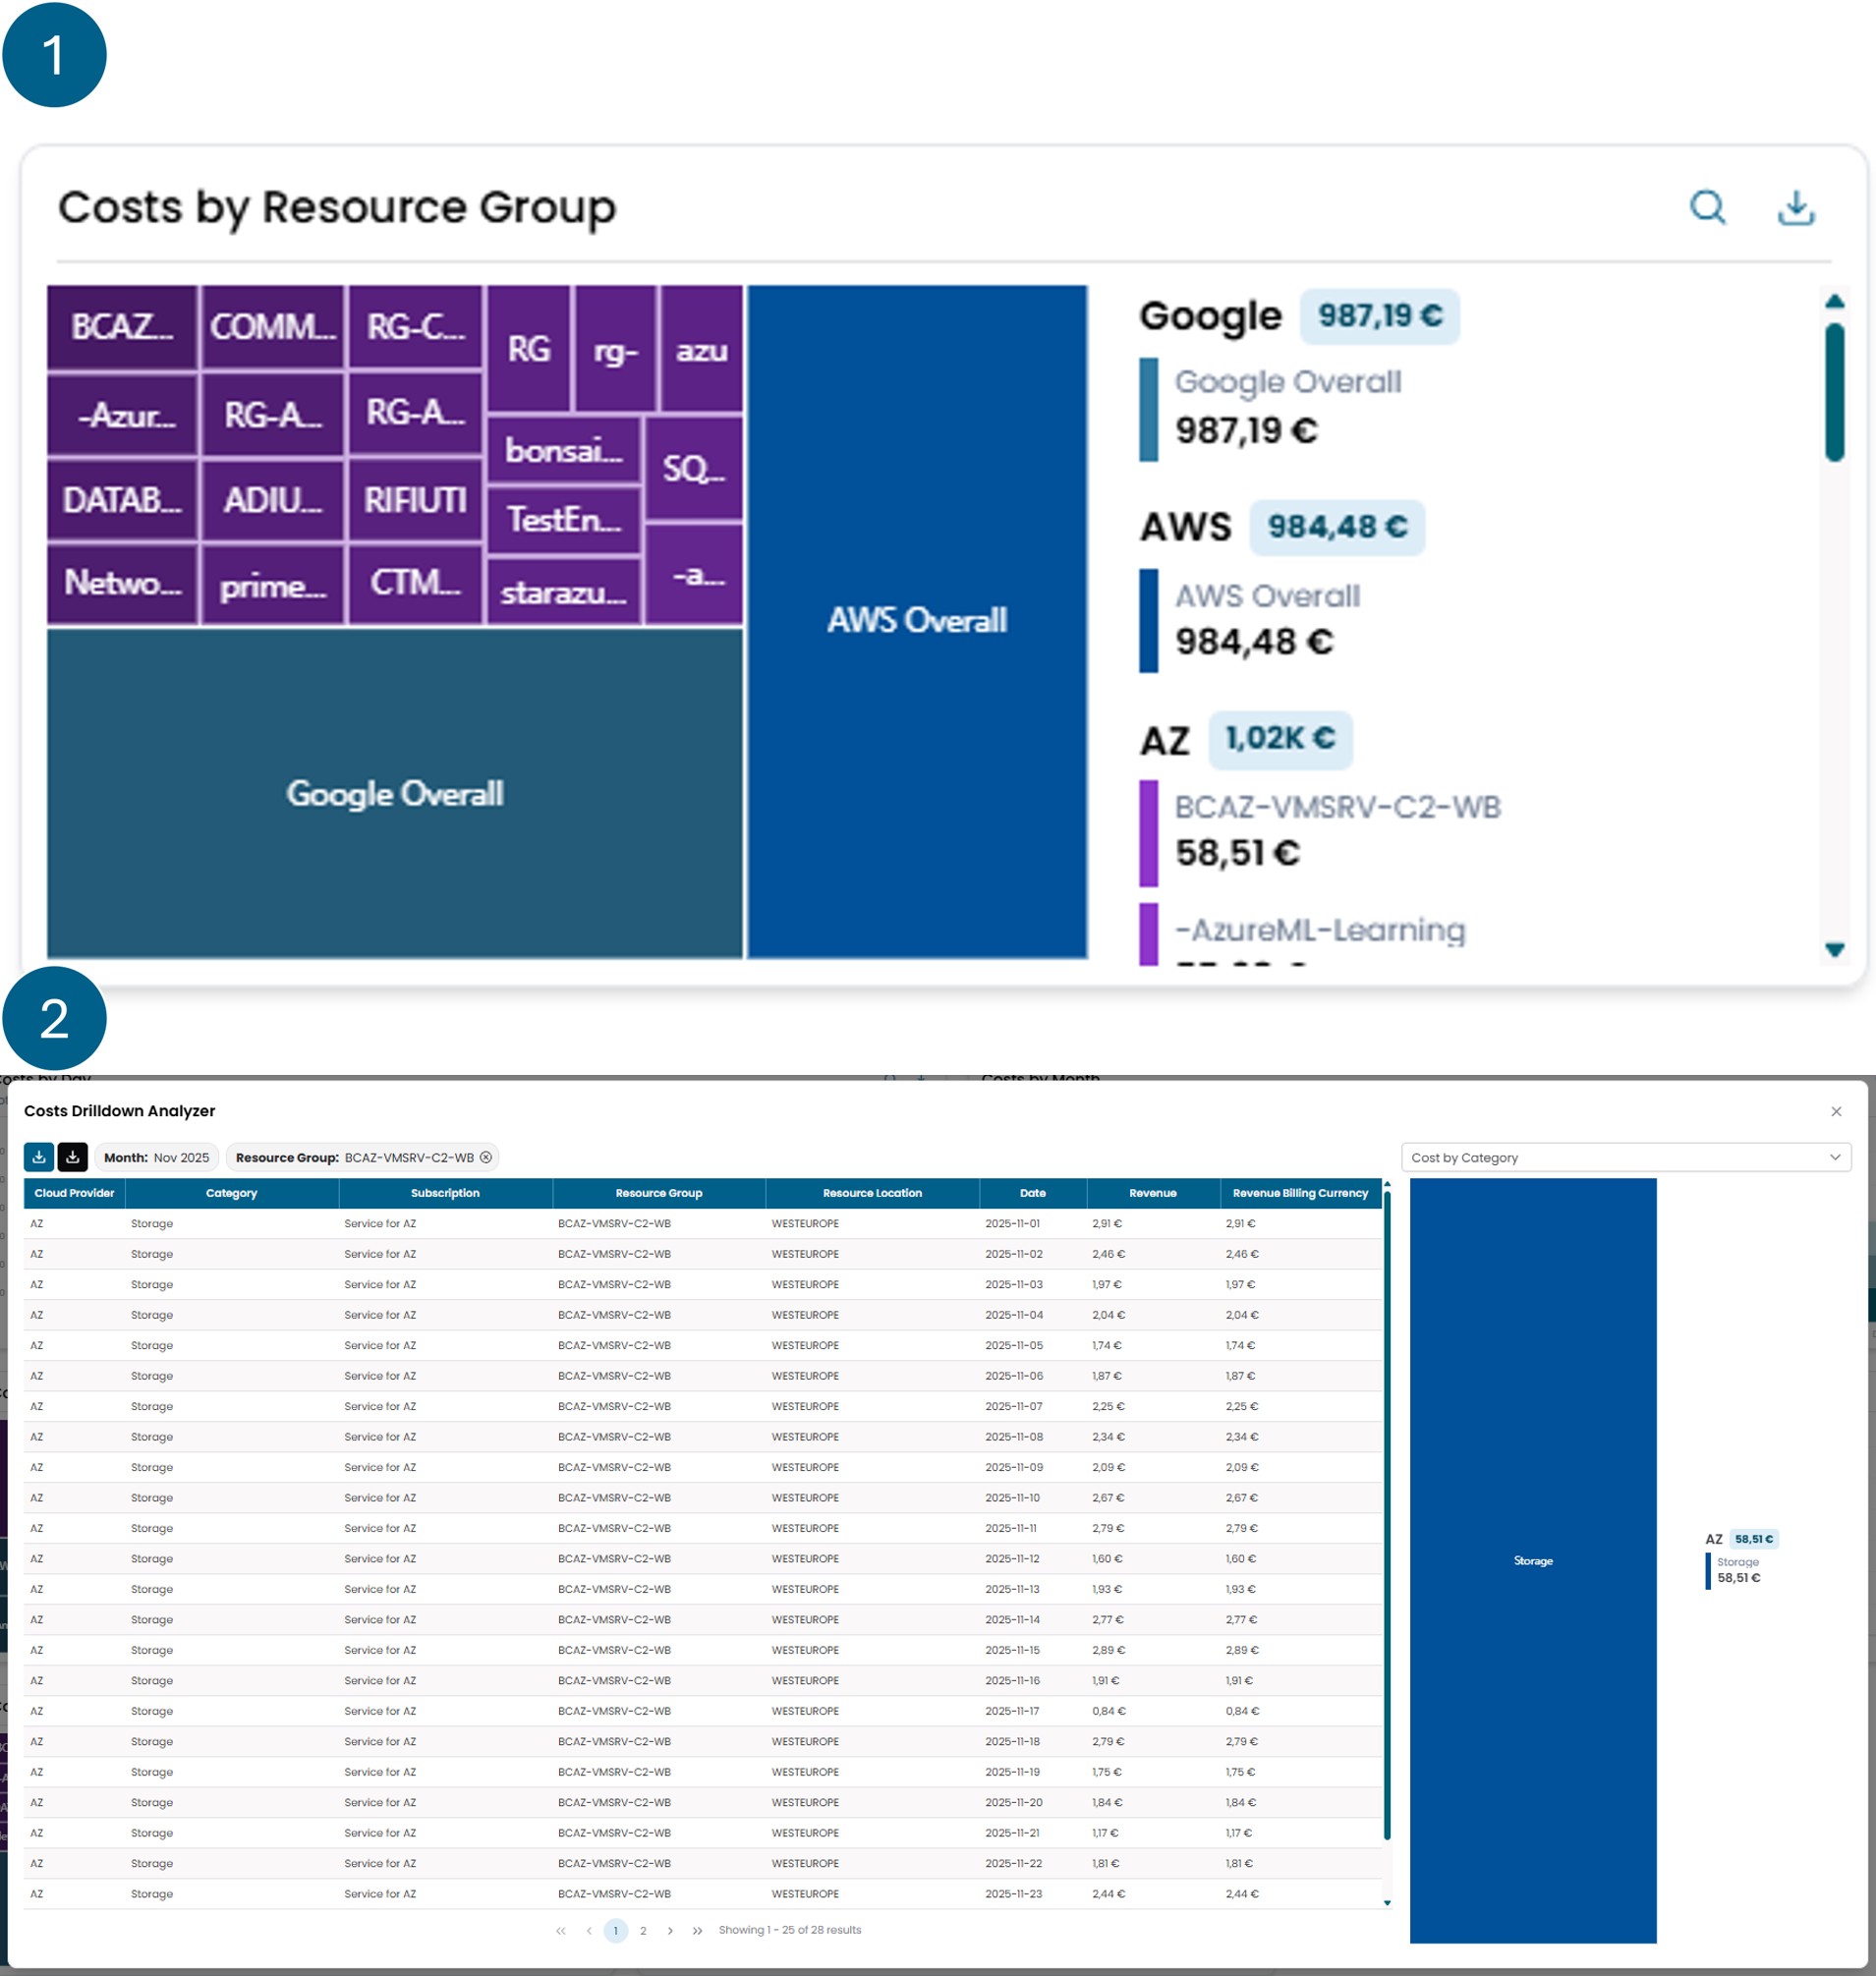
Costs By Resorurce Group
The widget is divided into two main views.
The first view shows the cloud costs of various providers,
grouped by Resorurce Group.
On the left is a graphical representation, while on the right
is a breakdown of the expenses.
By clicking on one of the sections of the chart, you access the
second view, where the costs that make up the selected category
are displayed.
From this screen, it is possible to apply further filters:
you can choose a criterion from the dropdown menu in the upper
right corner and then click on the corresponding slice that appears
just below.
This allows for progressively segmenting the cloud costs.
The applied filters can be removed by clicking the cross next to the
filter name, located above the cost table.
Also from this view, it is possible to:
- download the details shown in the cost table using the blue download button, located in the upper left;
- or export the report as provided directly by the cloud provider, with more complete information, using the black button next to the blue one.
There is a button in the top right corner that allows you to download the values displayed in the widget in Excel format.
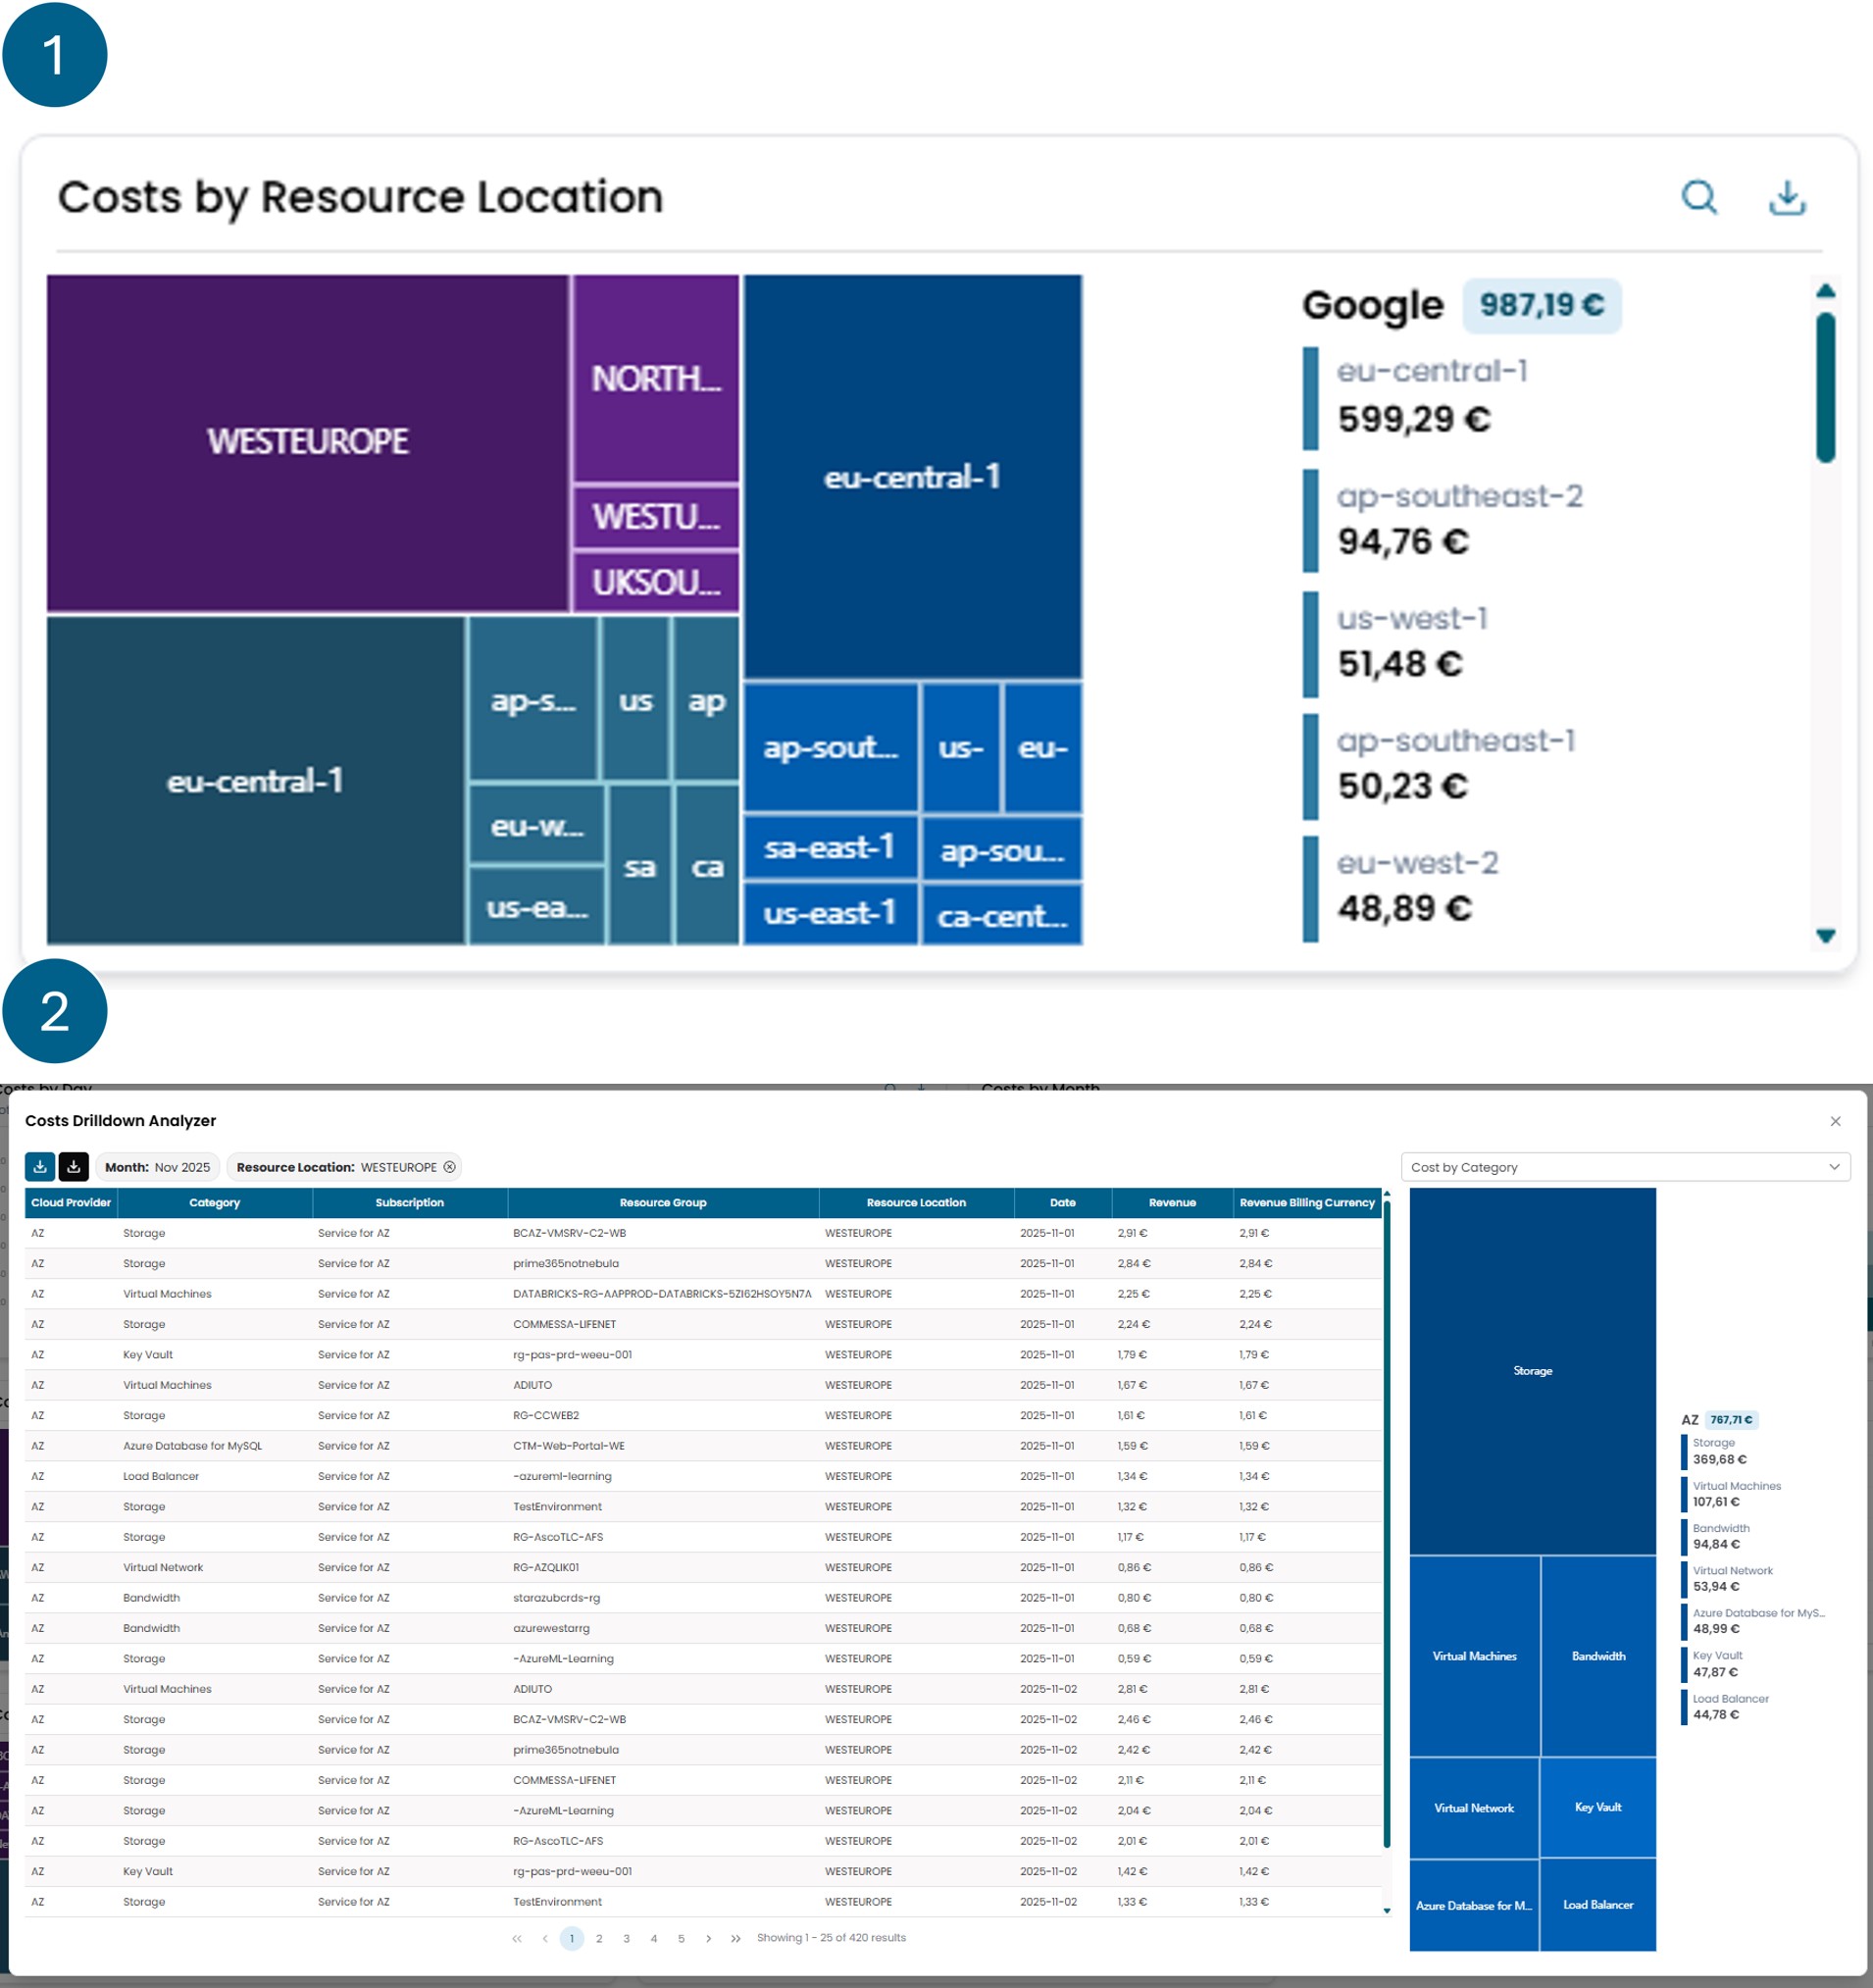
Costs By Resorurce Location
The widget is divided into two main views.
The first view shows the cloud costs of various providers,
grouped by Resorurce Location.
On the left is a graphical representation, while on the right
is a breakdown of the expenses.
By clicking on one of the sections of the chart, you access the
second view, where the costs that make up the selected category
are displayed.
From this screen, it is possible to apply further filters:
you can choose a criterion from the dropdown menu in the upper
right corner and then click on the corresponding slice that appears
just below.
This allows for progressively segmenting the cloud costs.
The applied filters can be removed by clicking the cross next to the
filter name, located above the cost table.
Also from this view, it is possible to:
- download the details shown in the cost table using the blue download button, located in the upper left;
- or export the report as provided directly by the cloud provider, with more complete information, using the black button next to the blue one.
There is a button in the top right corner that allows you to download the values displayed in the widget in Excel format.
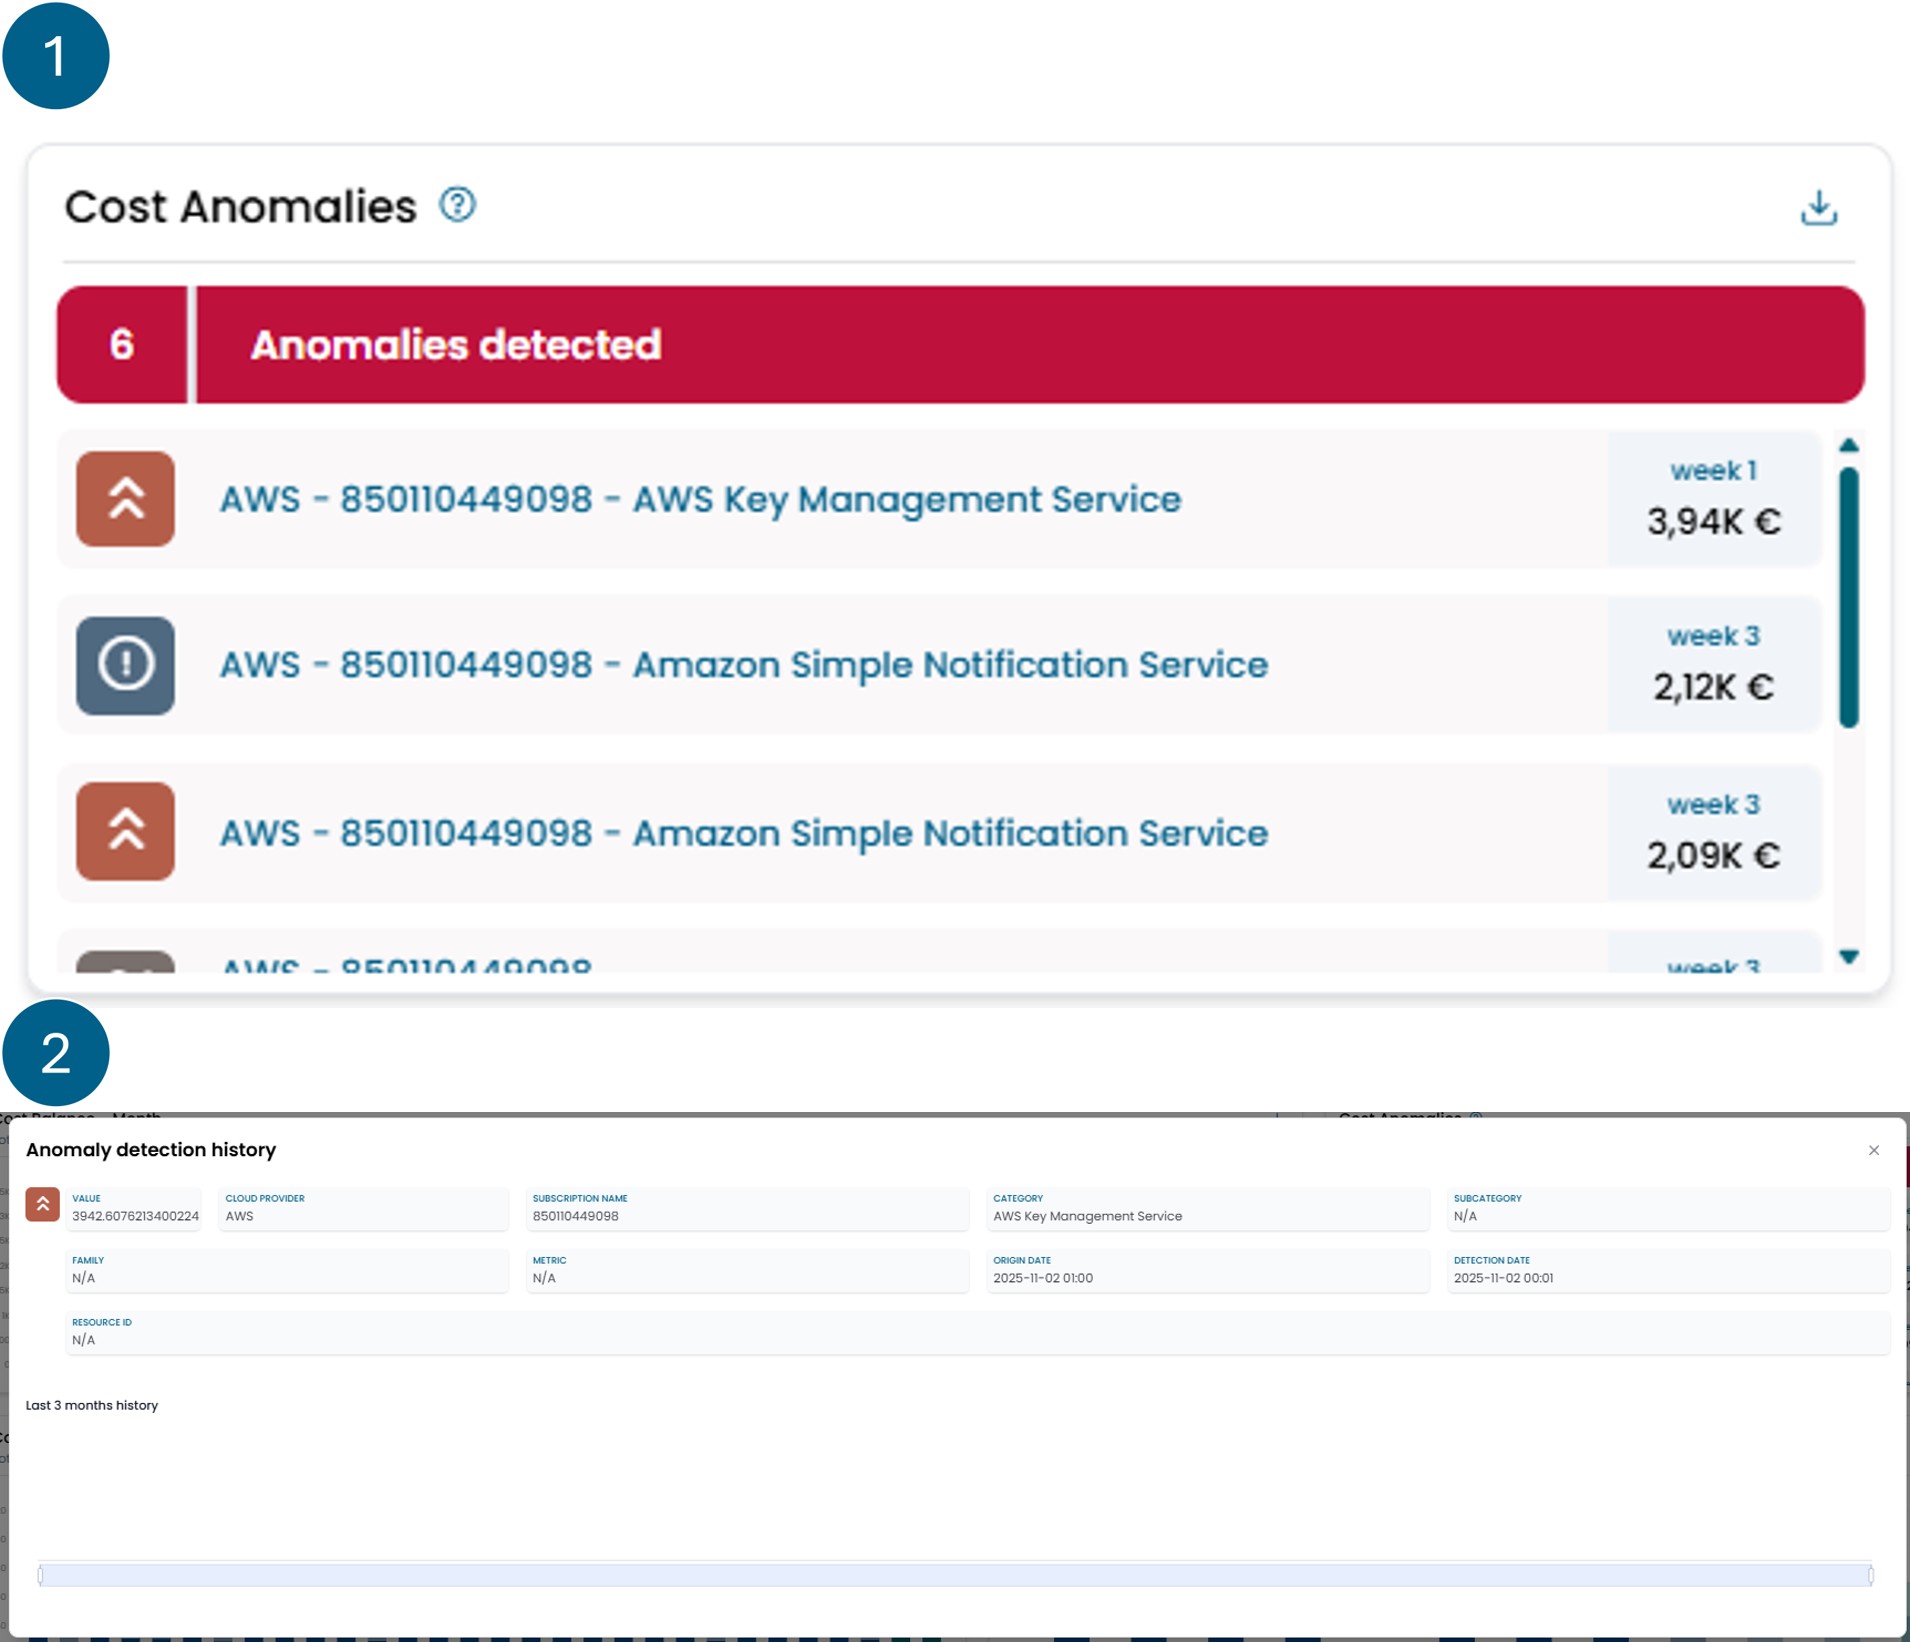
Cost Anomalies
This widget consists of two main views.
The first view shows a list of reports representing
the various cost anomalies automatically identified by XAutomata.
The reports are organized so that the most recent appear
first. If a cost center has recurring reports, these are
grouped within the last report. By selecting it, you can
view the list of previous reports, if any.
The second view opens by selecting a single report. This screen displays the details of the report and the history of expenses related to that specific cost center.
There is a button in the top right corner that allows you to download the values displayed in the widget in Excel format.
Info
What is a cost anomaly?
A cost anomaly is an unexpected cost behavior, detected in recent transactions. An anomaly does not necessarily involve a real problem, but they are intended to keep track of costs that can potentially be an indicator of some problems.
This widget shows a list of all the anomalies detected in the current period, which can be of different types:
- Peak: A cost considered to be significantly high compared to previous 3 months transactions.
- Total Peaks: It is recognized if new cost centers are impacting total spending abnormally.
- Fraud Protection: Using a time window of 3 months is established the behaviour of a cost centre and every 4 hours is verified if it exceed the expected expense.
- Forgotten: A cost that is constantly increasing over time without any fluctuation over the previous 3 months.
- Geography: A sudden cost in a geographic area where almost no costs have been produced for the past 3 months.
- Triple: A total month cost which value has tripled from the same category of 2 month back.