Navigation
This page describes how the XAUTOMATA interface is organized and how to move between its main sections.
Interface Layout
The interface is composed of three elements:
- a top bar — always visible, with navigation controls and user settings
- a left sidebar — with the main section menu
- a content area — where pages and dashboards are displayed
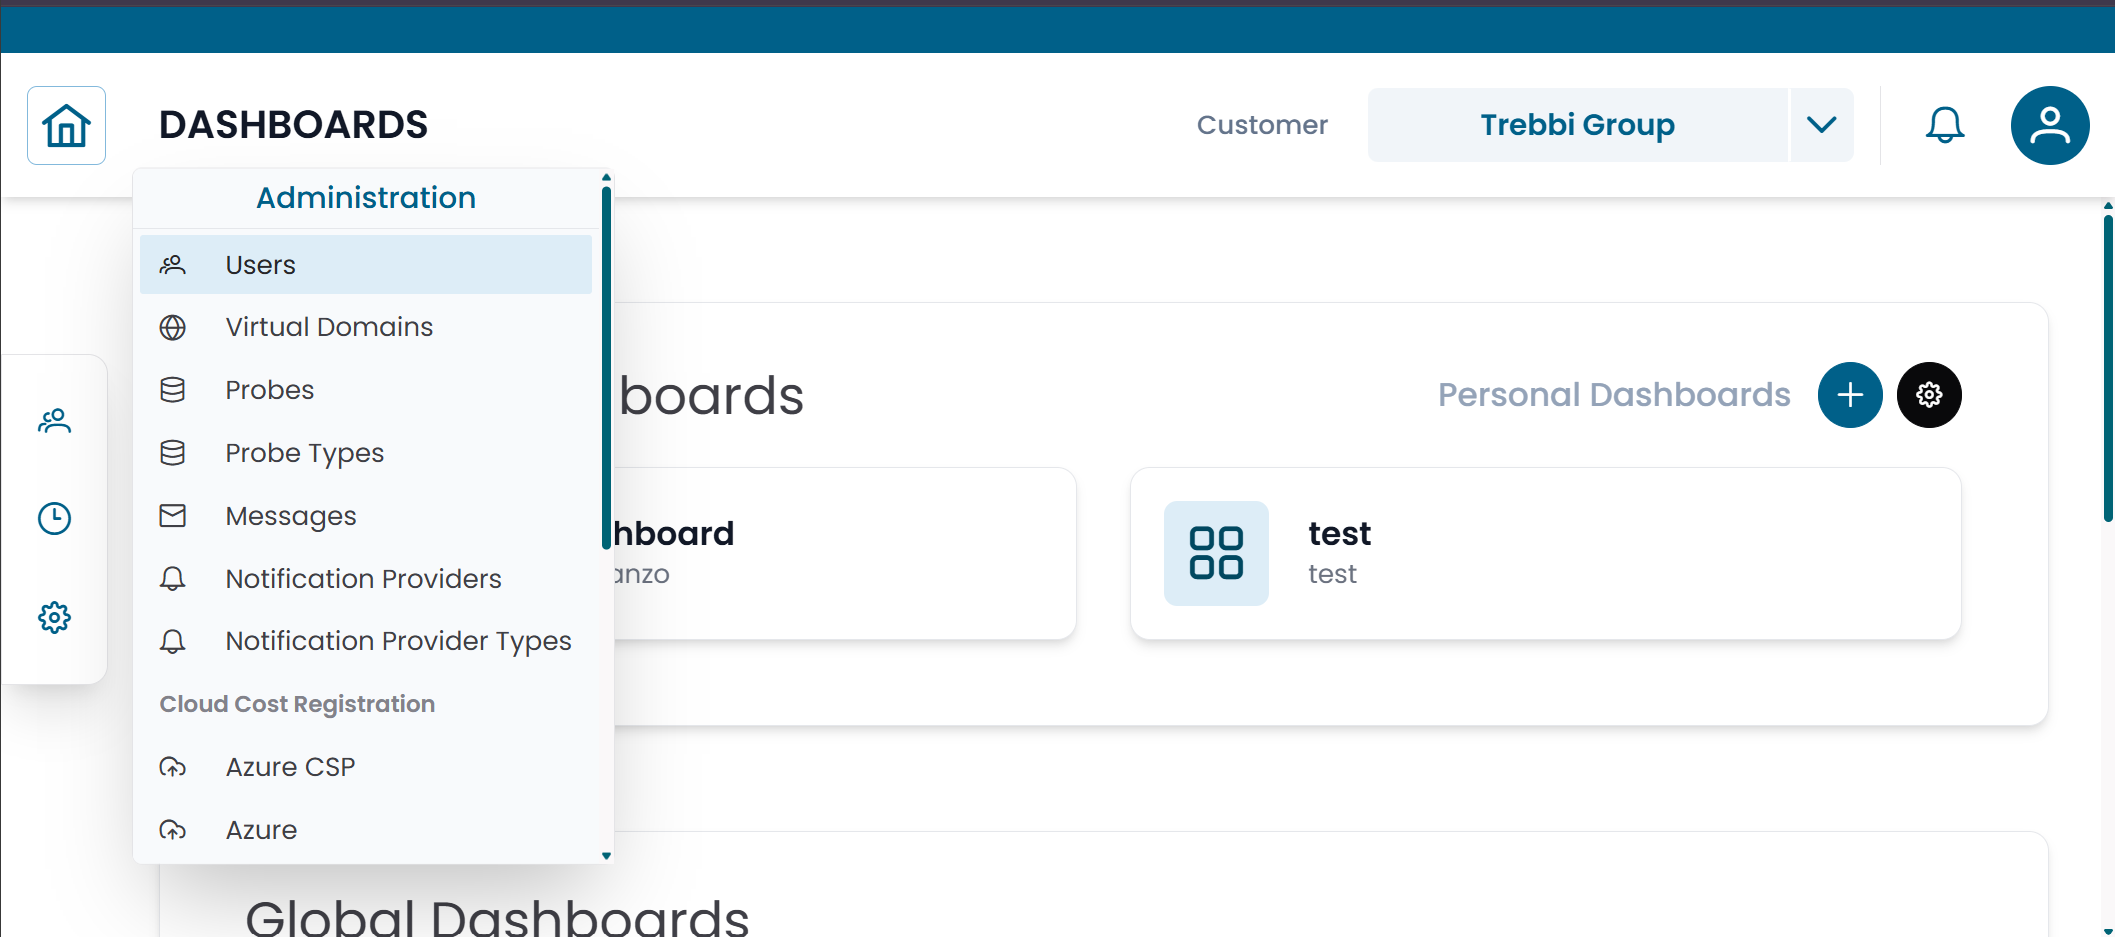
Fig.1 - Main interface layout
Top Bar
The top bar is always visible at the top of the screen.
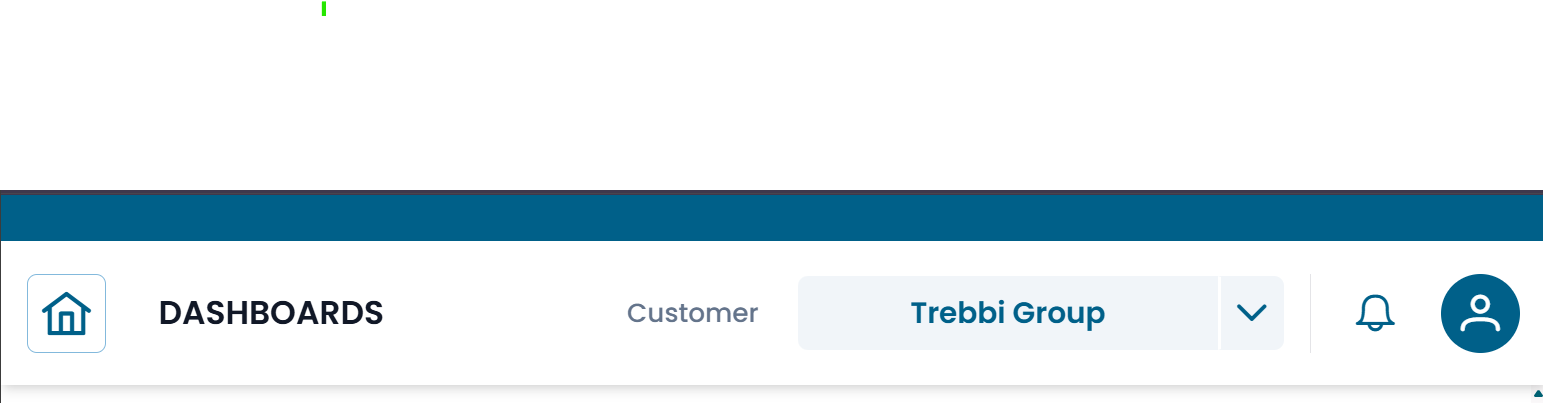
Fig.2 - Top bar
| Element | Position | Description |
|---|---|---|
| Home (⌂) | Left | Returns to the home screen from anywhere in the platform |
| Back (←) | Left | Navigates back to the previous page |
| Notifications (🔔) | Right | Shows system notifications |
| User (👤) | Right | Access your profile and log out |
Home Screen
Clicking Home brings you to the home screen, which acts as the starting point for customer navigation.
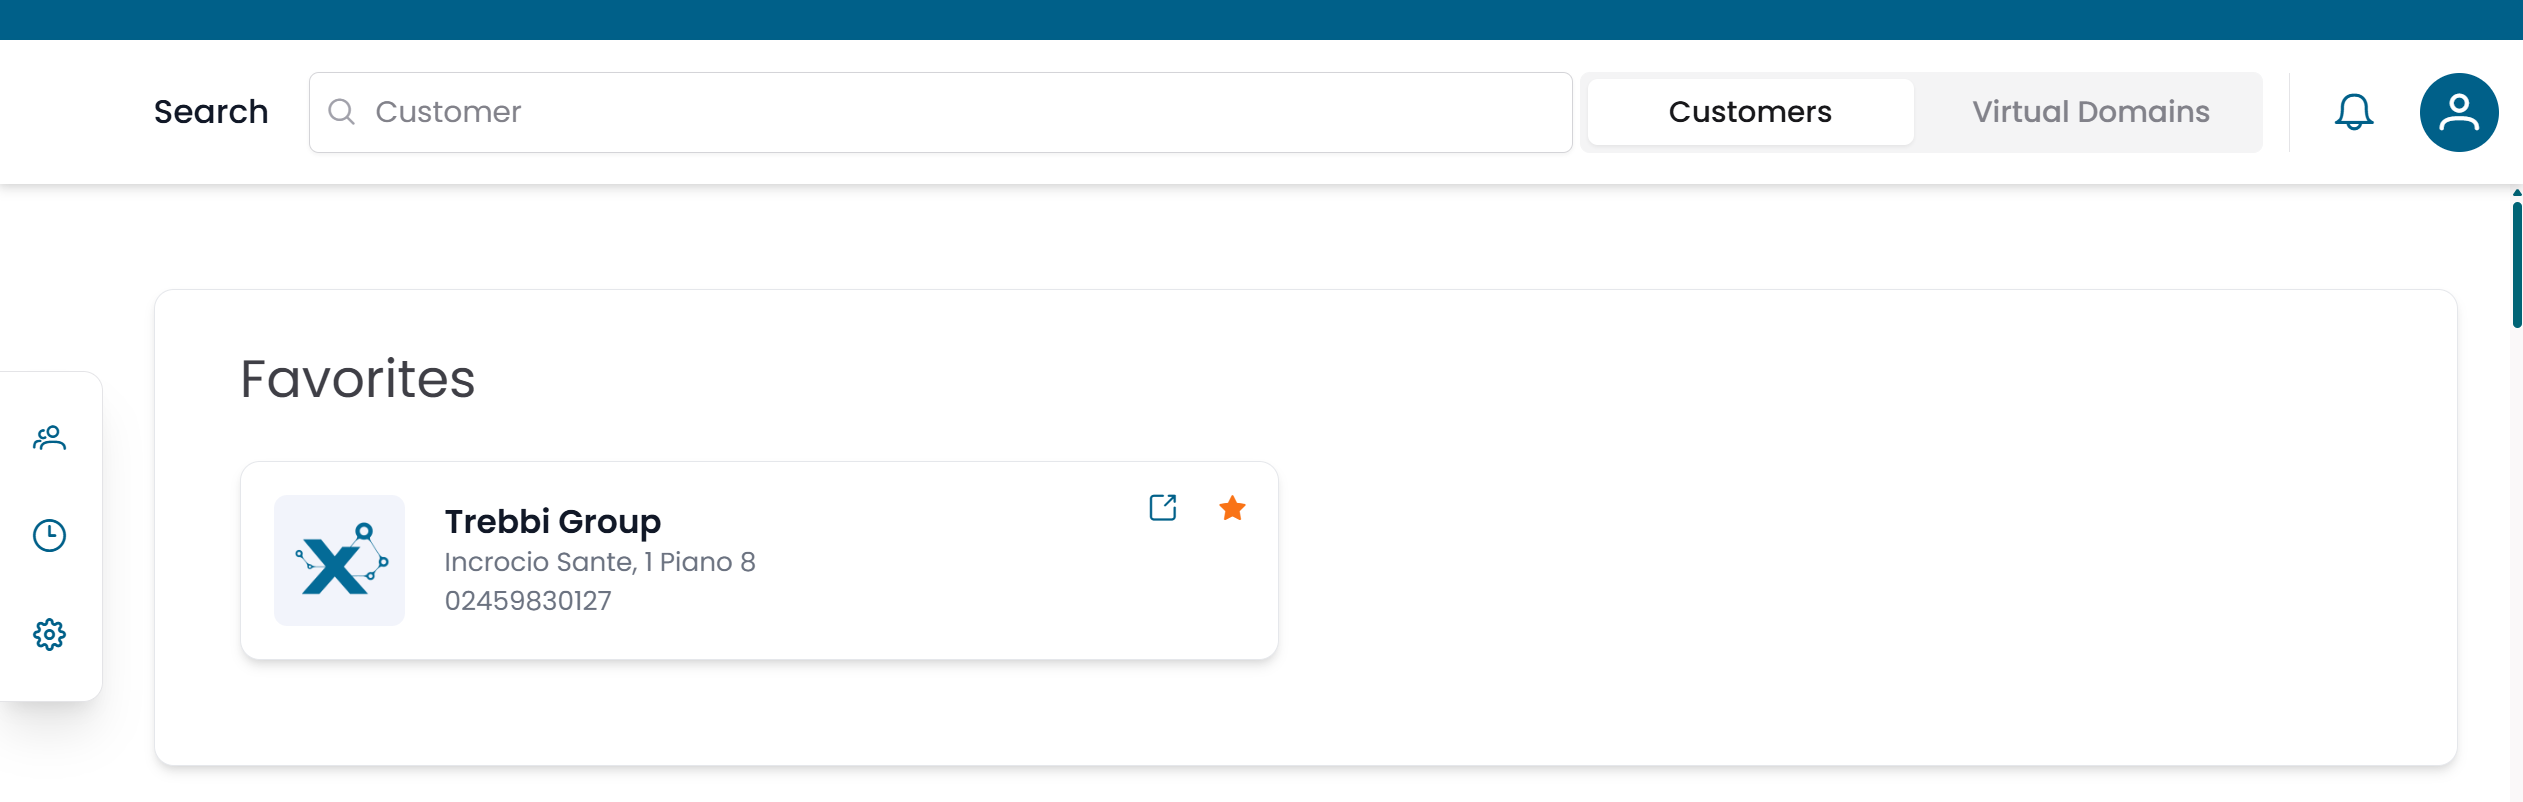
Fig.3 - Home screen with customer search
The home screen displays:
- a Search bar — type a customer name to filter the list
- a Customers / Virtual Domains switch — toggle between browsing by customer or by virtual domain
- a Favorites list — customers you have starred for quick access
Click any customer in the list to open their structure and navigate their infrastructure.
Left Sidebar
The left sidebar is the main navigation menu. Click any section to expand it.
Customers
The Customers section contains the repositories used to model organizations and their monitored infrastructure.
| Subsection | Contents |
|---|---|
| Client Repository | Customers, Sites, Contacts |
| Objects Repository | Groups, Objects, Metric Types, Metrics, Services |
Use this section to browse the monitored infrastructure, inspect metric data, and manage organizational entities.
Tracking
The Tracking section provides tools to manage operational events and planned activities.
| Page | Purpose |
|---|---|
| Calendars | Define time schedules for monitoring operations |
| Downtimes | Schedule maintenance windows to suppress alerts |
| Dispatchers | Configure automated actions triggered by monitoring events |
Administration
The Administration section contains platform-level configuration tools.
| Page | Purpose |
|---|---|
| Users | Manage user accounts and permissions |
| Virtual Domains | Organize users, groups, and probes into scopes |
| Probes | Manage monitoring agents |
| Probe Types | View available monitoring integration types |
| Messages | Configure notification content templates |
| Notification Providers | Configure external delivery channels |
| Notification Provider Types | View available notification integration types |
Note
Administration pages are only visible to users with the appropriate permissions. Super Admin tools are visible only to Super Admin users.
Sidebar Footer
At the bottom of the sidebar you will find links to Terms and Conditions, Contacts, and Support.
How to Navigate
The typical workflow in the platform follows this pattern:
- Open the home screen to select a customer, or use the left sidebar to go directly to a section.
- Within any section, use the pre-filter to search for records, then open them from the results table.
- Access dashboards from the left sidebar under the relevant customer context.
For a detailed explanation of how entity sections work (pre-filter, table, CRUD dialog, connections), see Working with Entities.
Visibility and Permissions
What you see in the interface depends on your account configuration:
- sections and menu items you do not have access to are hidden or disabled
- dashboards are only shown if your account has visibility over at least one widget they contain
- records within sections are scoped to the customers and groups linked to your account
If you cannot find a section or a dashboard you expect to see, contact your administrator to review your account permissions.