Downtimes
The Downtimes section allows you to temporarily suspend monitoring alerts for selected infrastructure elements during planned activities such as maintenance, upgrades, or network reconfigurations.
Info
During a downtime, the platform continues to collect monitoring data — only alert notifications are suppressed. This means you can still review metric history after the maintenance window closes.
Where to Manage Downtimes
Downtimes can be managed in two ways:
- From the Tracking section — for a centralized view of all active and scheduled downtimes across the infrastructure.
- Directly from the hierarchy — by clicking the Downtime action button on any element in the Tree Hierarchy View (groups, objects, metric types, metrics).
Both paths open the same Active Downtimes modal for the selected entity.
Opening the Downtimes Section
From the main navigation menu, go to Tracking → Downtimes.
The interface opens with a pre-filter dialog. Fill in one or more fields to narrow the search, then click APPLY.
Typical filter fields include:
| Filter field | Description |
|---|---|
| Name | Name of the downtime rule |
| Entity type | Type of entity the downtime applies to (Group, Object, Metric Type, Metric) |
| Status | Active or Disabled |
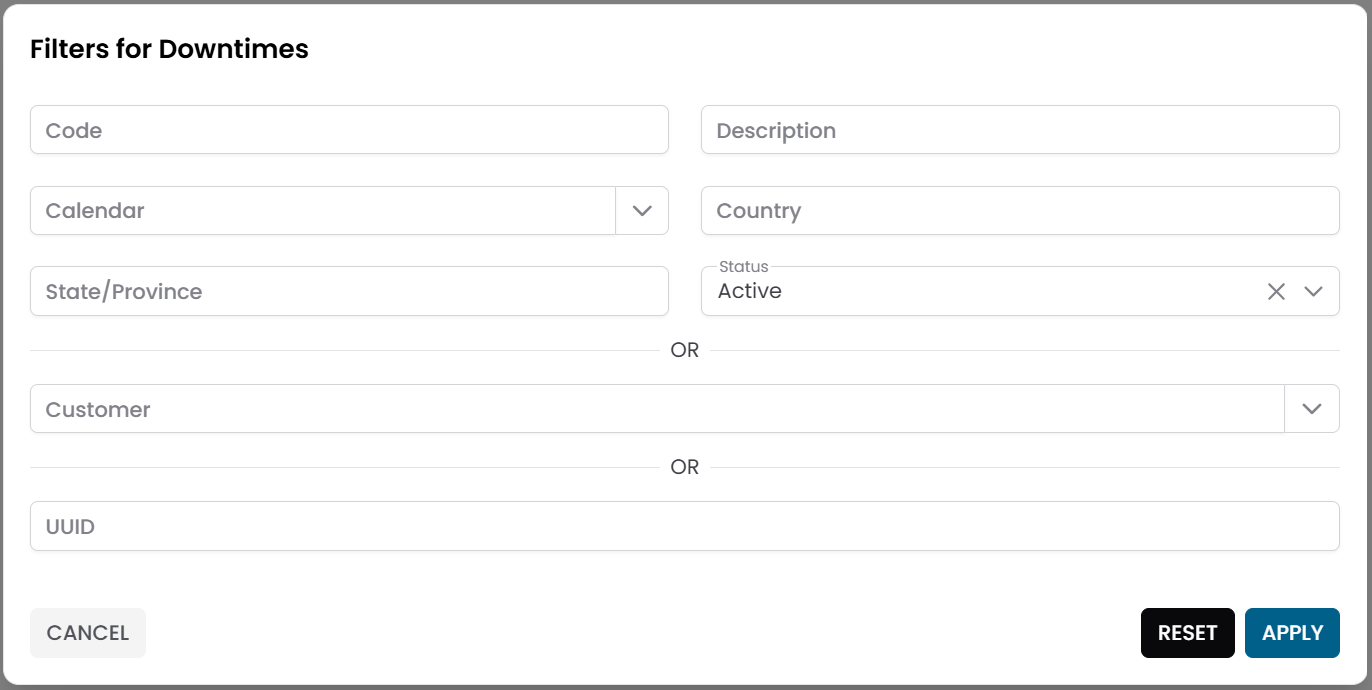
Fig.1 - Downtimes pre-filter dialog
Downtimes Table
After applying the filter, the results appear in a table where each row represents a downtime record.
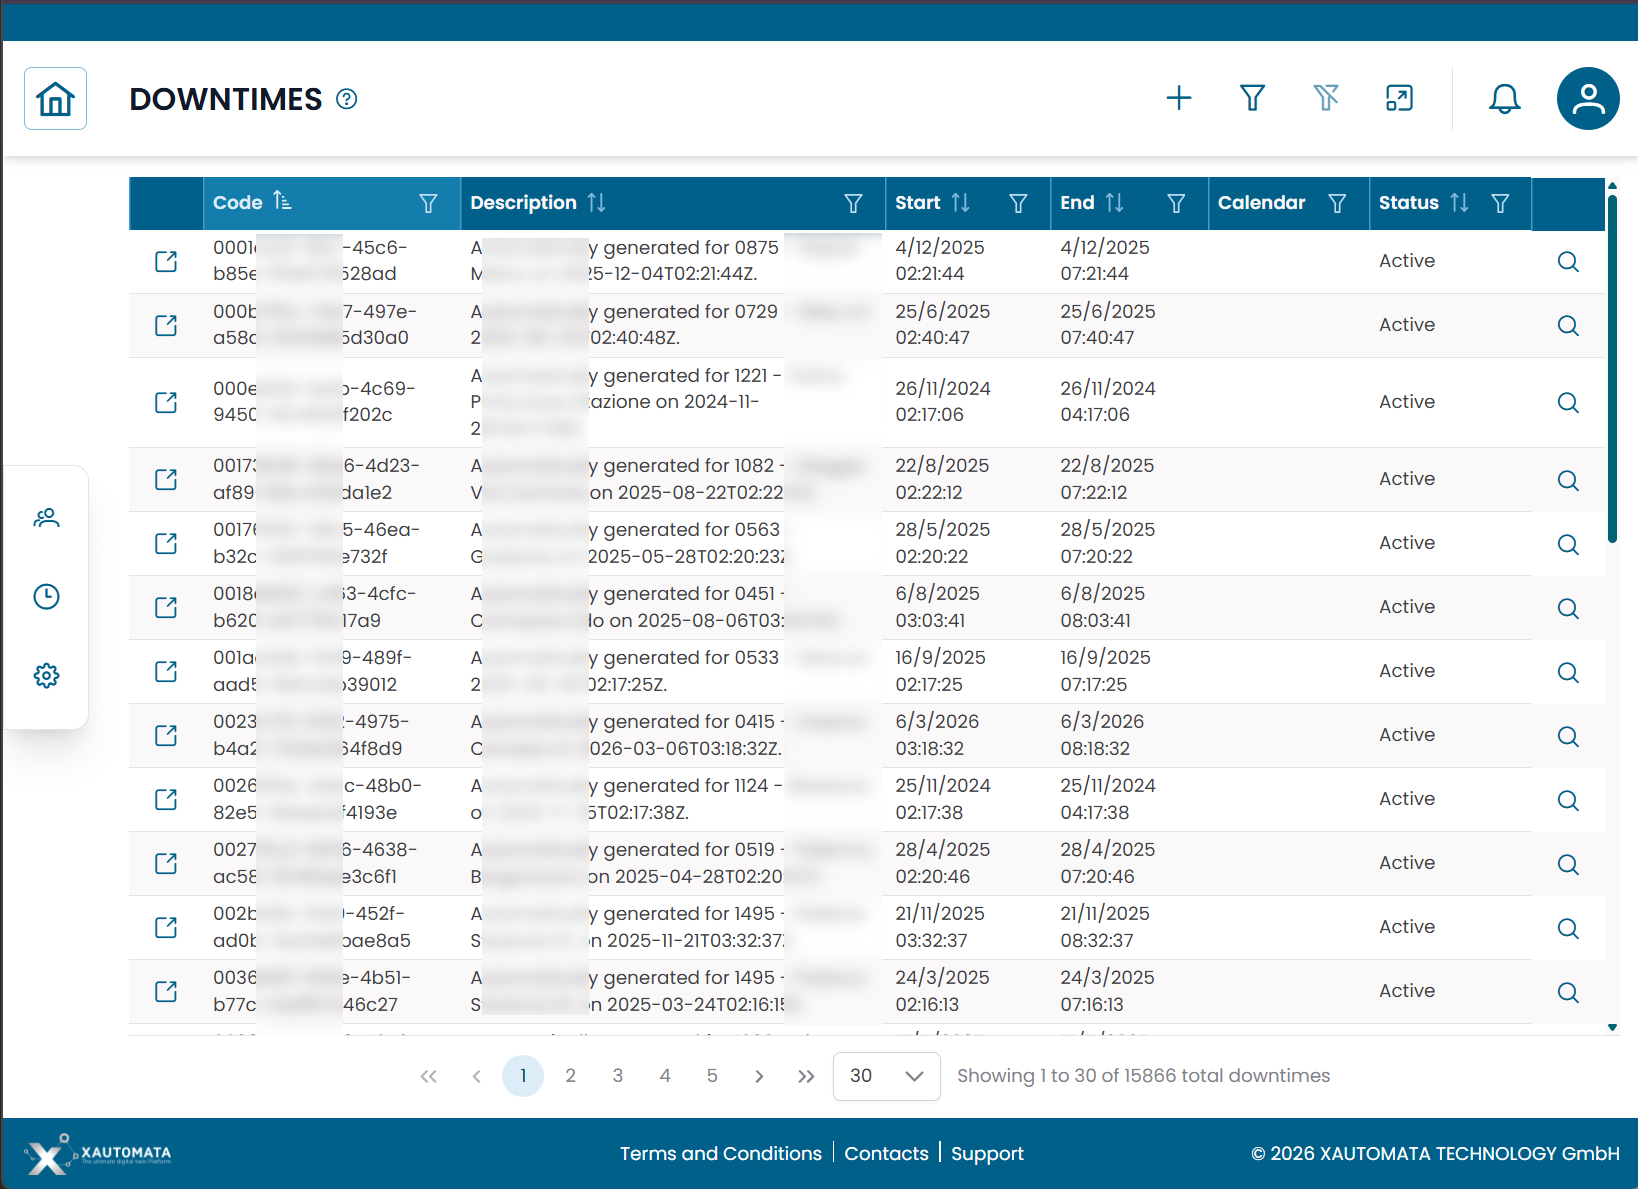
Fig.2 - Downtimes results table
Creating a Downtime
The most common way to create a downtime is directly from the infrastructure hierarchy:
- Navigate to the entity you want to silence — a group, object, metric type, or metric — using the Tree Hierarchy View.
- Click the Downtime action button on the target row.
- In the Active Downtimes modal, click NEW.
- Fill in the downtime details (see fields below).
- Click SAVE CHANGES.
Note
Applying a downtime to a group or object silences alerts for all descendant elements in the hierarchy. Use this to suppress an entire section of the infrastructure at once.
Downtime fields
| Field | Description |
|---|---|
| Name | Name of the downtime rule |
| Start | Date and time when the downtime begins |
| End | Date and time when the downtime ends |
| Calendar | Optional calendar to restrict the downtime to specific time windows |
| Status | Active or Disabled |
| Notes | Optional notes |
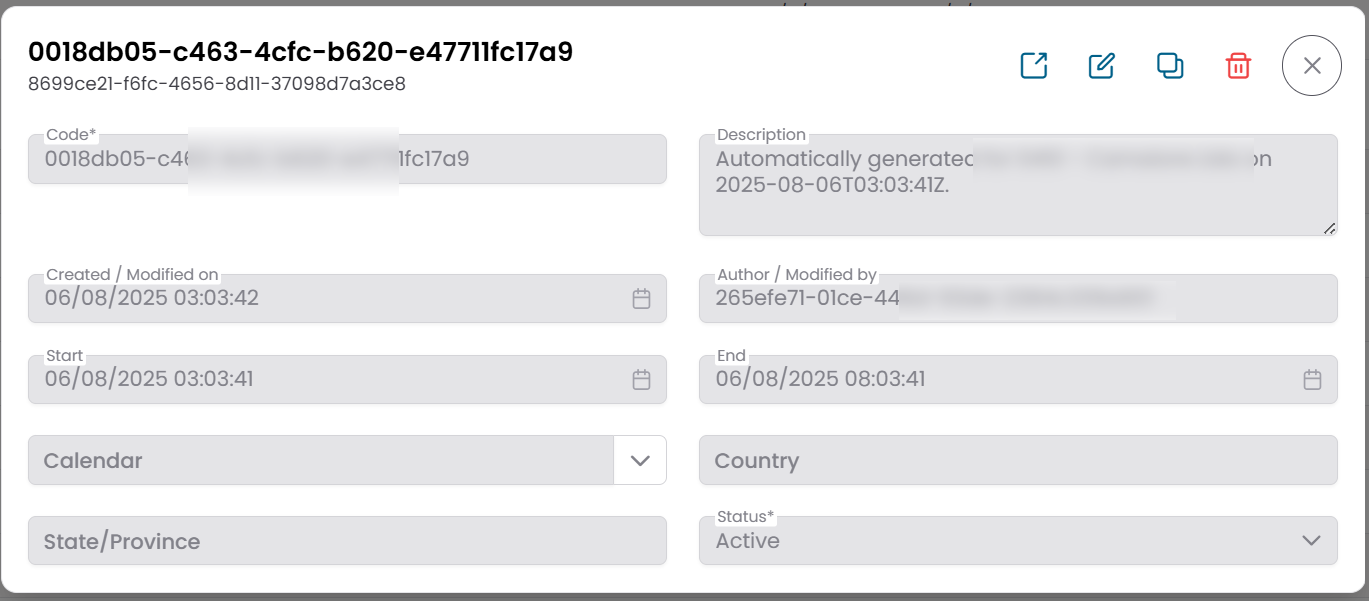
Fig.3 - Downtime edit dialog
Typical Use Cases
| Scenario | Recommended level |
|---|---|
| Server maintenance | Object |
| Network device upgrade | Object or Group |
| Site-wide planned outage | Group (top-level) |
| Single metric anomaly (known noise) | Metric or Metric Type |
Mass Downtime
To apply a downtime to multiple entities at once, select them in any hierarchy or table view and use Massive Downtime.
This creates a single downtime rule applied to all selected elements simultaneously, saving time during large maintenance windows.
Note
To control when a downtime is active using a time schedule, associate it with a Calendar. To automate operational responses when alerts fire, see Dispatchers.