Metrics
The Metrics section gives access to the time-series data collected from monitored resources. Each metric record represents the actual measured values produced by a probe for a given metric type — for example, the CPU usage readings recorded every five minutes from a specific server.
Info
Metrics are the lowest level of the monitoring hierarchy. They are generated automatically by probes and are not created manually. Use this section to inspect measurement history and to apply operational actions such as downtimes and dispatchers.
Opening the Metrics Section
From the main navigation menu, go to Customers → Objects Repository → Metrics.
The interface opens with a pre-filter dialog. Fill in one or more fields to narrow the search, then click APPLY.
| Filter field | Description |
|---|---|
| Name | Name of the metric |
| Description | Optional description |
| Profile | Classification of the metric |
| Metric Type | Metric type the metric belongs to |
| Status | Active or Disabled |
By default, the pre-filter is set to show only active metrics. Leave other fields empty and click APPLY to load all active metrics.
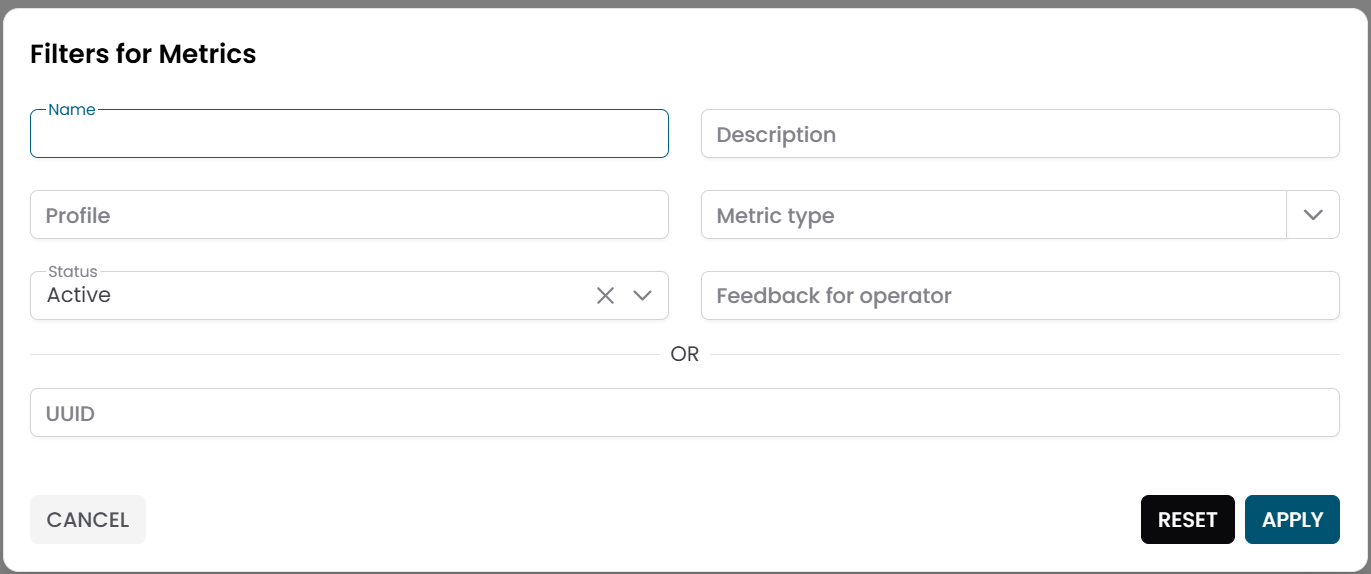
Fig.1 - Metrics pre-filter dialog
Metrics Table
After applying the filter, the results appear in a table where each row represents a metric record.
Typical columns include:
- Name
- Description
- Profile
- Metric Type
- Status
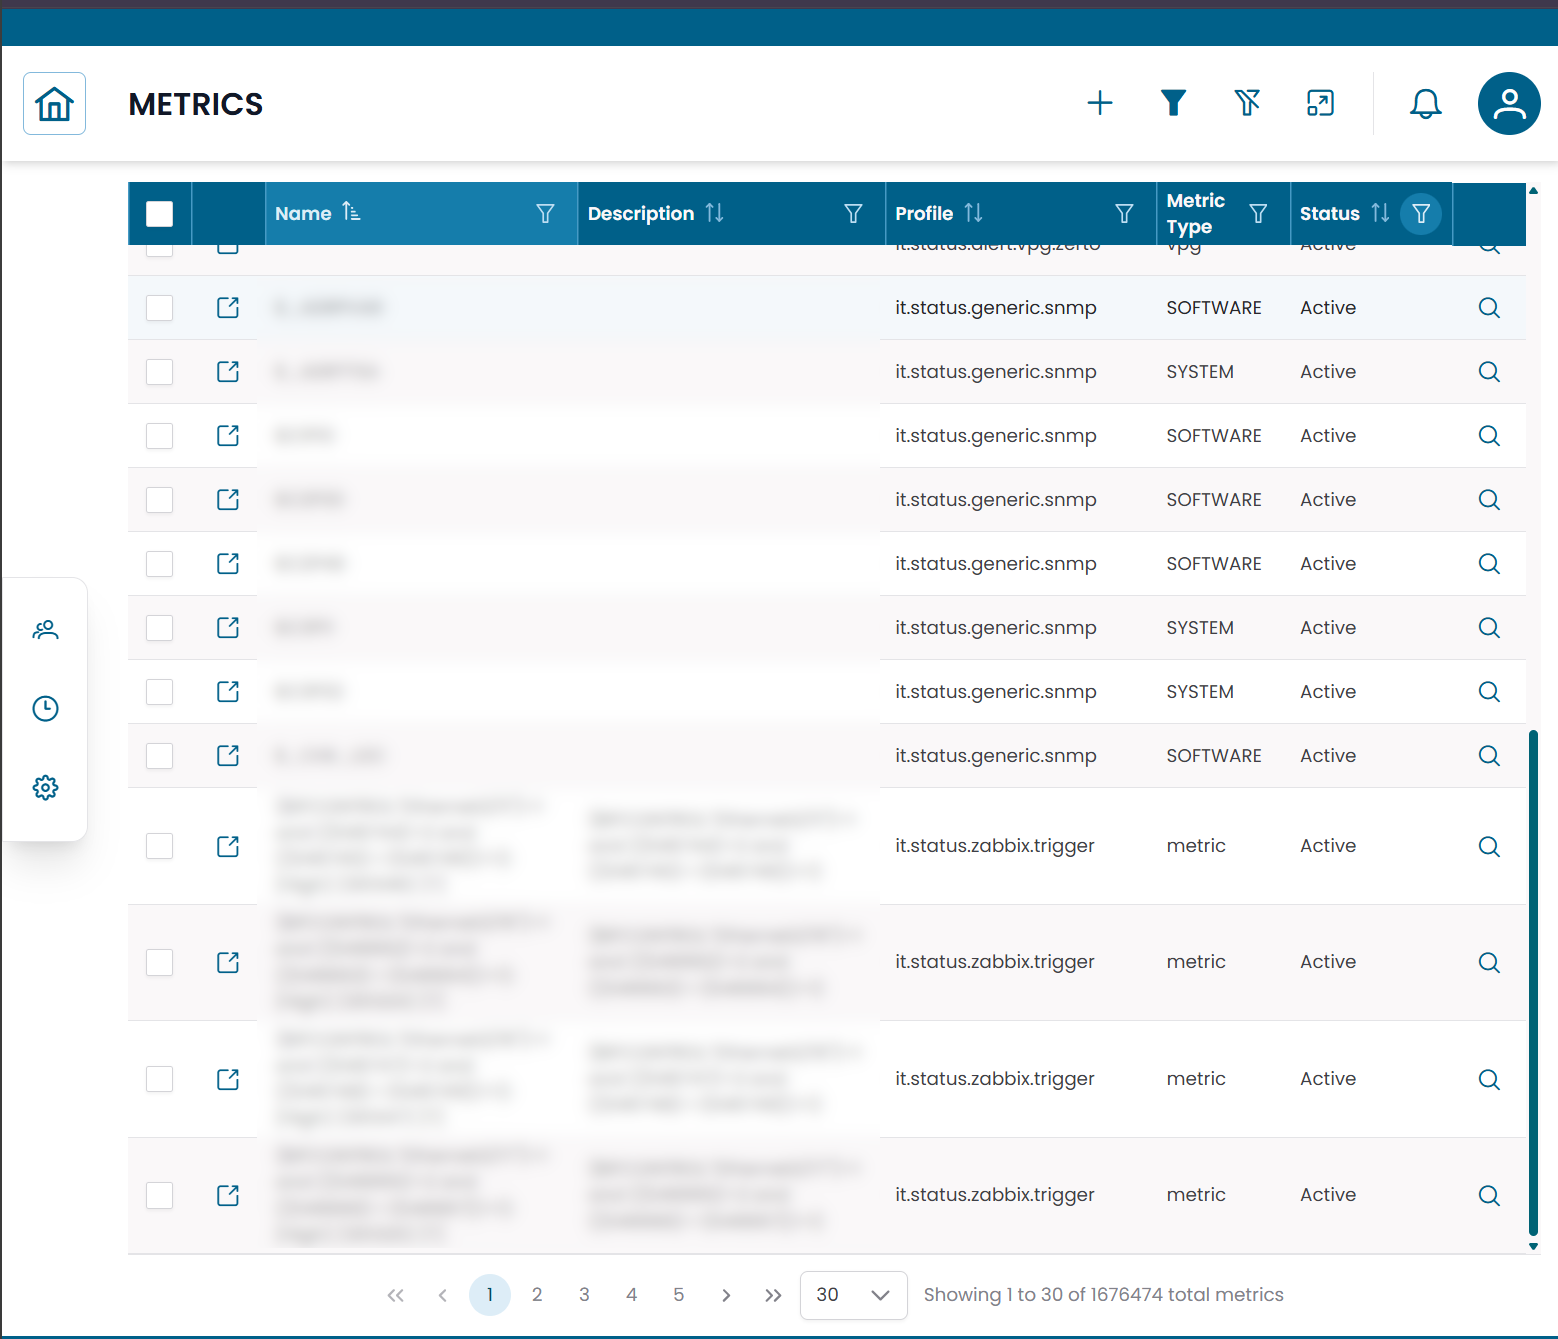
Fig.2 - Metrics results table
Metric Details
Click the search icon (🔍) on any row to open the metric record.
The CRUD dialog displays the configuration of the metric:
| Field | Description |
|---|---|
| Name | Name of the metric |
| Description | Optional description |
| Profile | Classification of the metric |
| Metric Type | Parent metric type |
| Data Profile | JSON configuration for the metric |
| Automata Domain | Automation scope |
| Status | Active or Disabled |
| Feedback for Operator | Notes or guidance for the operator |
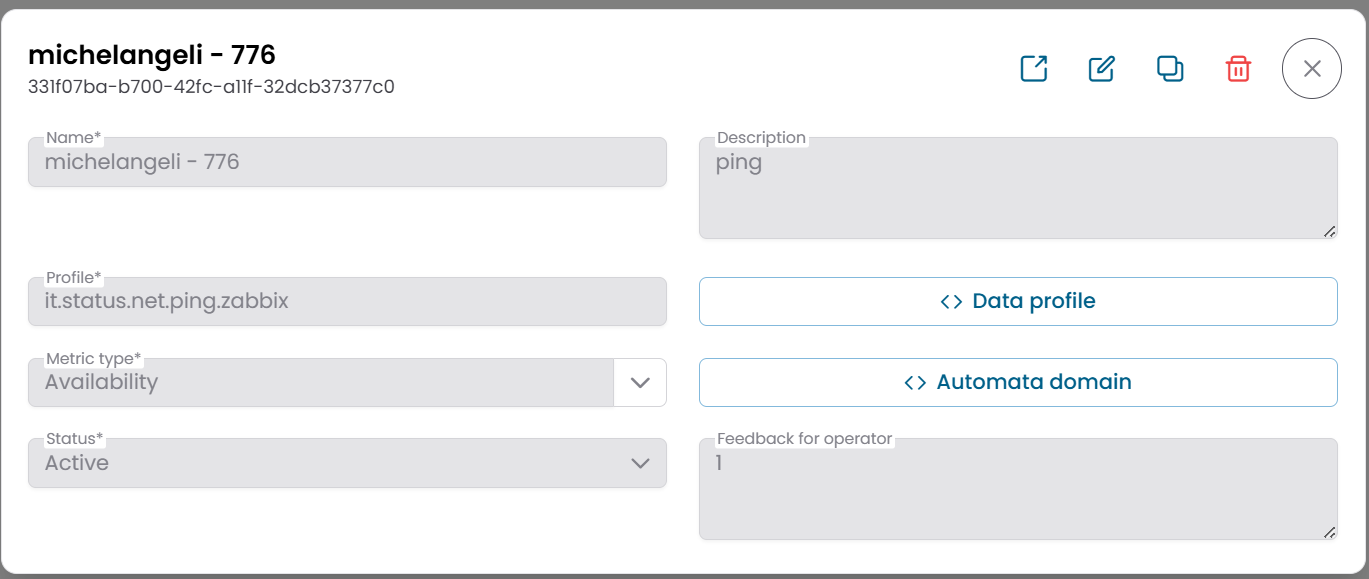
Fig.3 - Metric detail dialog
Viewing Metric Data
To inspect the historical values recorded for a metric, click the Metric Data action button on the metric row.
This opens a dialog showing the measurement history for the selected metric.
The display format depends on the metric type:
| Metric type | Display format |
|---|---|
| Value metric (numerical) | Time-series chart (e.g. CPU %, latency, traffic) |
| Status metric (state-based) | Table with timestamps and state values (e.g. OK / Warning / Critical) |
Use this view to analyze trends, identify anomalies, or verify that monitoring data is being collected correctly.
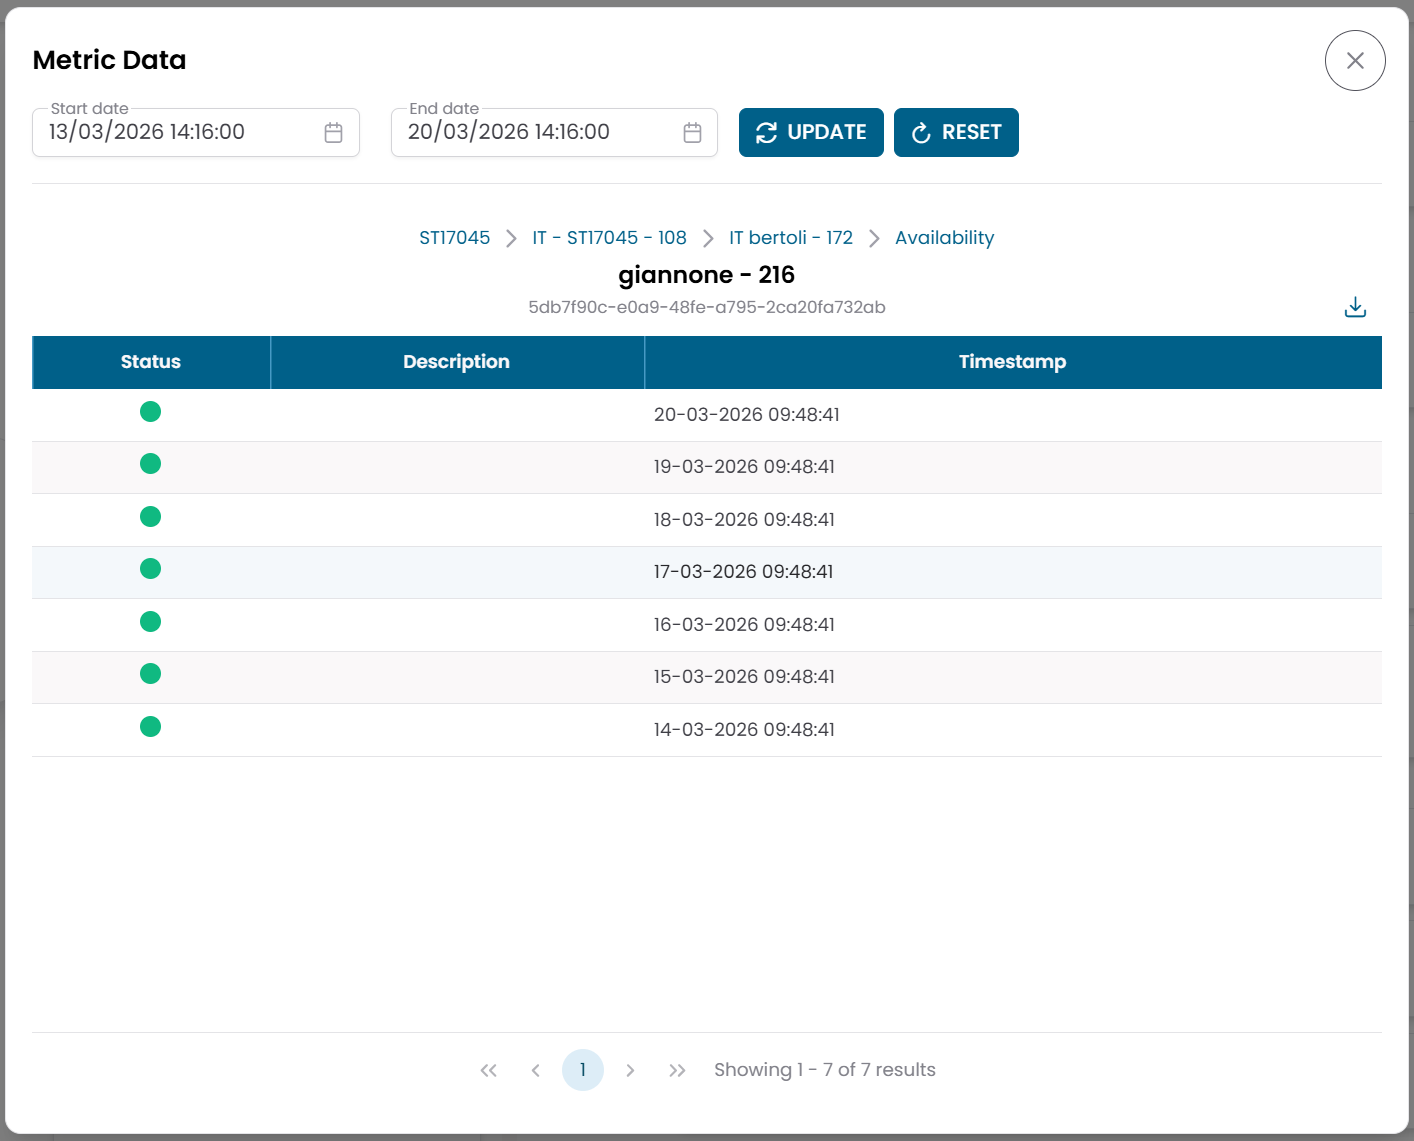
Fig.4 - Metric Data dialog — chart view
Operational Actions
From the metrics table or from the hierarchy view inside a metric type or object, you can apply the following actions to one or more metrics:
| Action | Description |
|---|---|
| Downtime | Temporarily suspend monitoring alerts for the selected metric |
| Dispatcher | Configure an automated response triggered by this metric's conditions |
To apply the same action to multiple metrics at once, select them in the table and use:
- Massive Downtime
- Massive Dispatcher
Connections View
Click the link icon (🔗) on any row to open the Connections View for that metric.
This view shows the entities linked to the metric:
| Tab | Description |
|---|---|
| Services | Services this metric is associated with |
| Downtimes | Active maintenance windows for this metric |
| Dispatchers | Active automation rules linked to this metric |
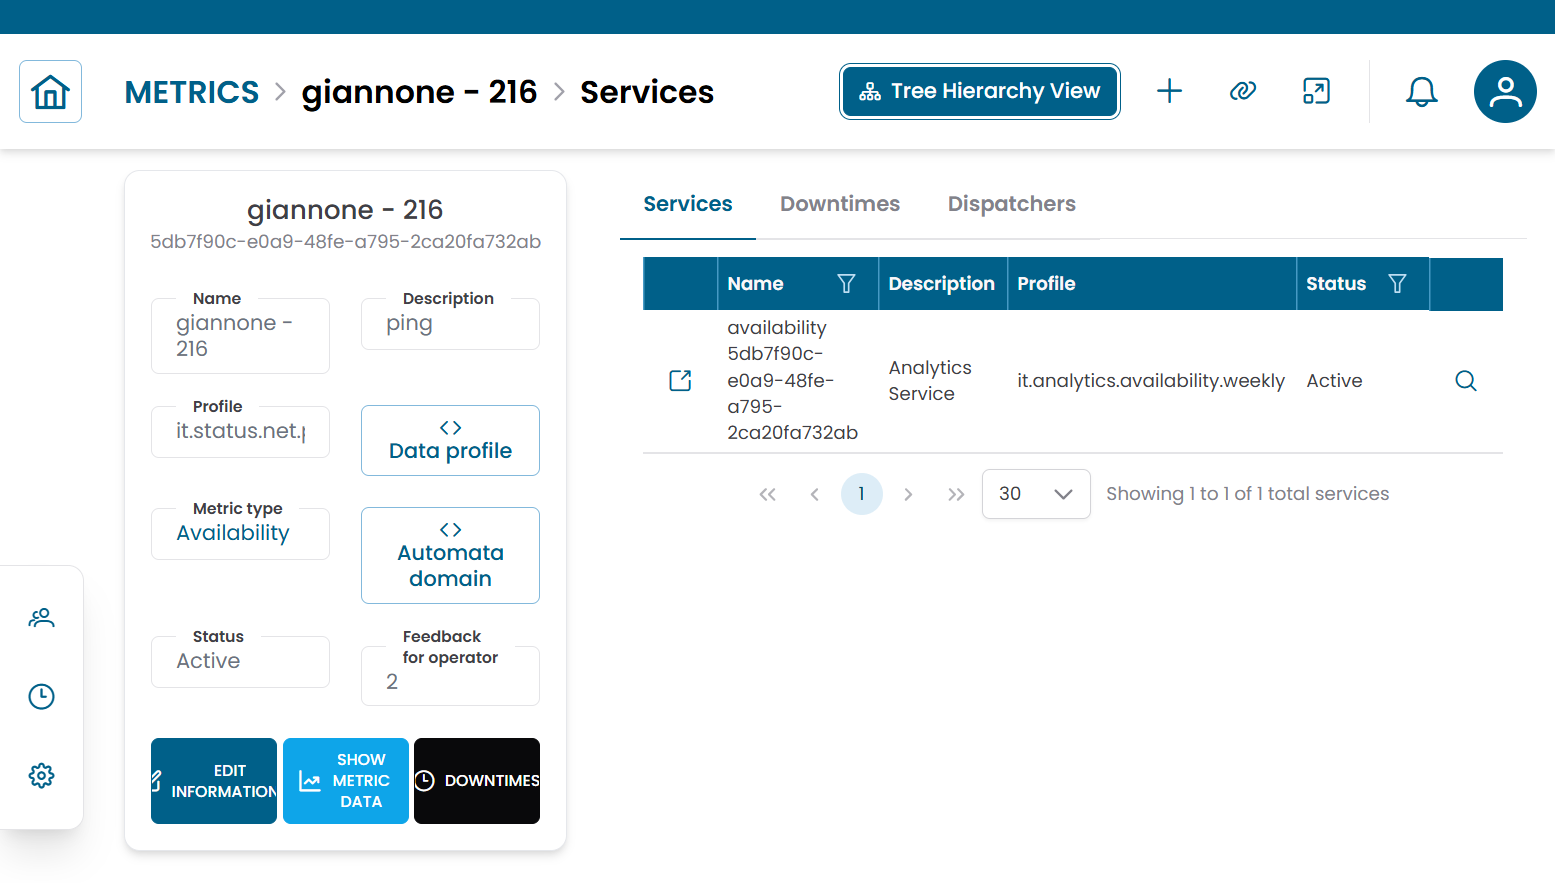
Fig.5 - Metric connections view
Note
Metrics are most commonly accessed from within the hierarchy of an object or metric type, rather than directly from this section. For context on where metrics sit in the monitoring model, see Metric Types and Objects.