Probes
The Probes section manages the monitoring agents that collect data from infrastructure resources and send it to XAUTOMATA. Each probe is the operational bridge between a monitored resource and the platform — without probes, no metrics are collected.
Opening the Probes Section
From the main navigation menu, go to Administration → Probes.
The interface opens with a pre-filter dialog. Fill in one or more fields to narrow the search, then click APPLY.
| Filter field | Description |
|---|---|
| Name | Name of the probe |
| Description | Optional description |
| Probe Type | Type of monitoring integration |
| Object | Infrastructure resource the probe monitors |
| Virtual Domain | Administrative domain the probe belongs to |
| Status | Active, Disabled, or Maintenance |
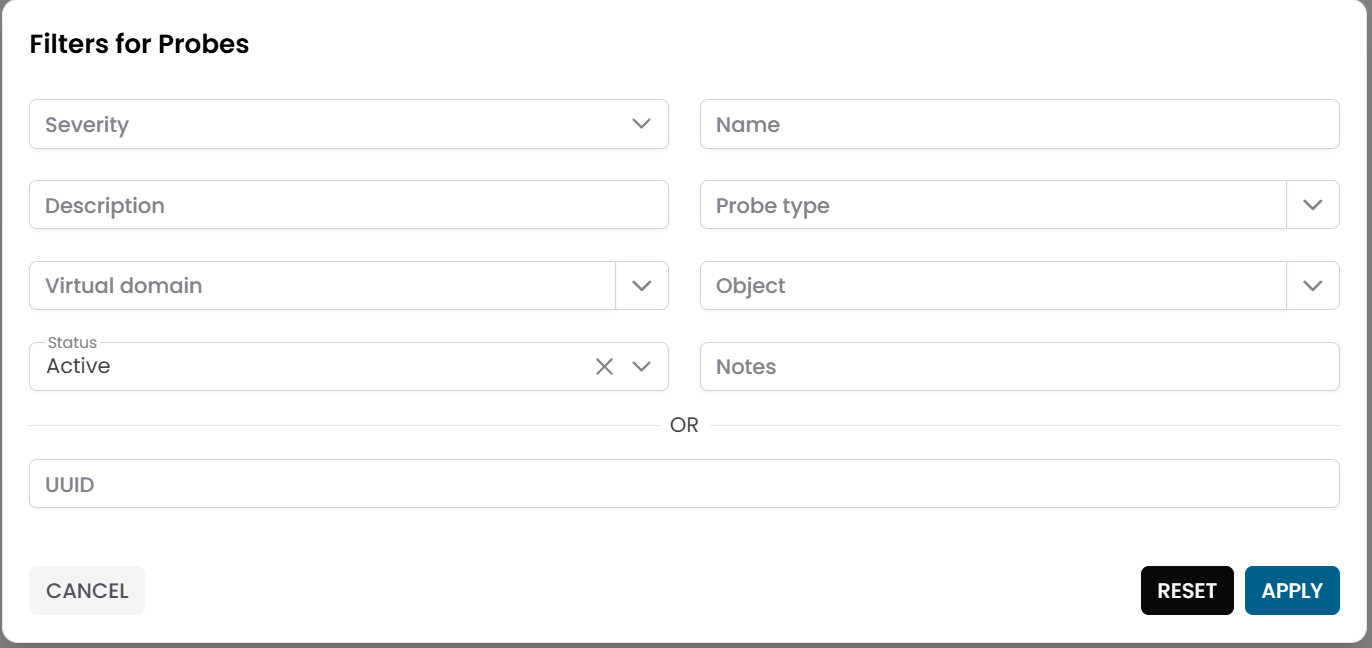
Fig.1 - Probes pre-filter dialog
Probes Table
After applying the filter, the results appear in a table where each row represents a probe.
In addition to the standard fields, the table displays key health indicators:
| Column | Description |
|---|---|
| Severity | Current operational condition of the probe |
| Last Seen | Timestamp of the last communication with the platform |
| Ingest Frequency | Expected interval between data updates |
Use Severity and Last Seen to quickly identify probes that may be offline or experiencing issues.
Warning
If a probe's Last Seen timestamp is significantly older than its Ingest Frequency, the probe may have stopped collecting data. Investigate connectivity, configuration, or the status of the monitored resource.
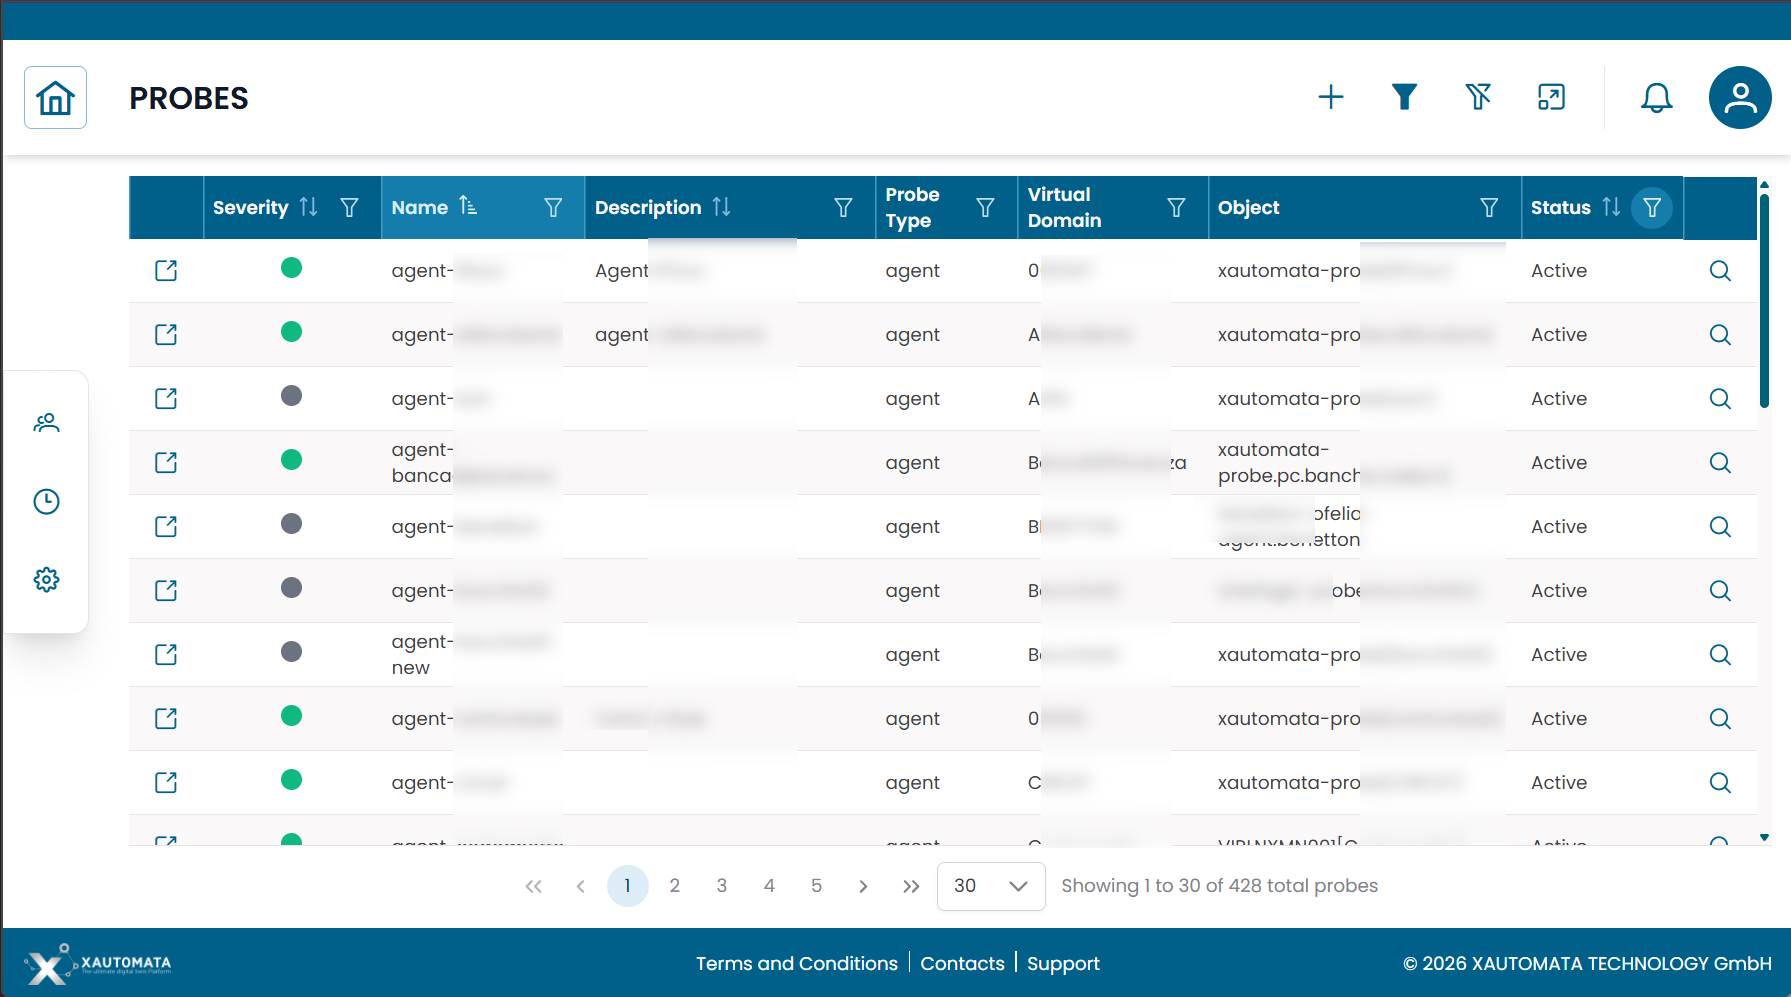
Fig.2 - Probes results table
Probe Details
Click the search icon (🔍) on any row to open the probe record.
| Field | Description |
|---|---|
| Name | Name of the probe |
| Description | Optional description |
| Probe Type | Type of monitoring integration used |
| Object | Monitored infrastructure resource |
| Virtual Domain | Administrative domain |
| Data Profile | JSON configuration for the probe behavior |
| Status | Active, Disabled, or Maintenance |
| Notes | Optional notes |
From this dialog you can:
- edit the probe configuration
- duplicate the record
- delete the record
Note
The Data Profile field contains the technical configuration required for the probe to operate. Do not edit it unless instructed by the XAUTOMATA delivery team.
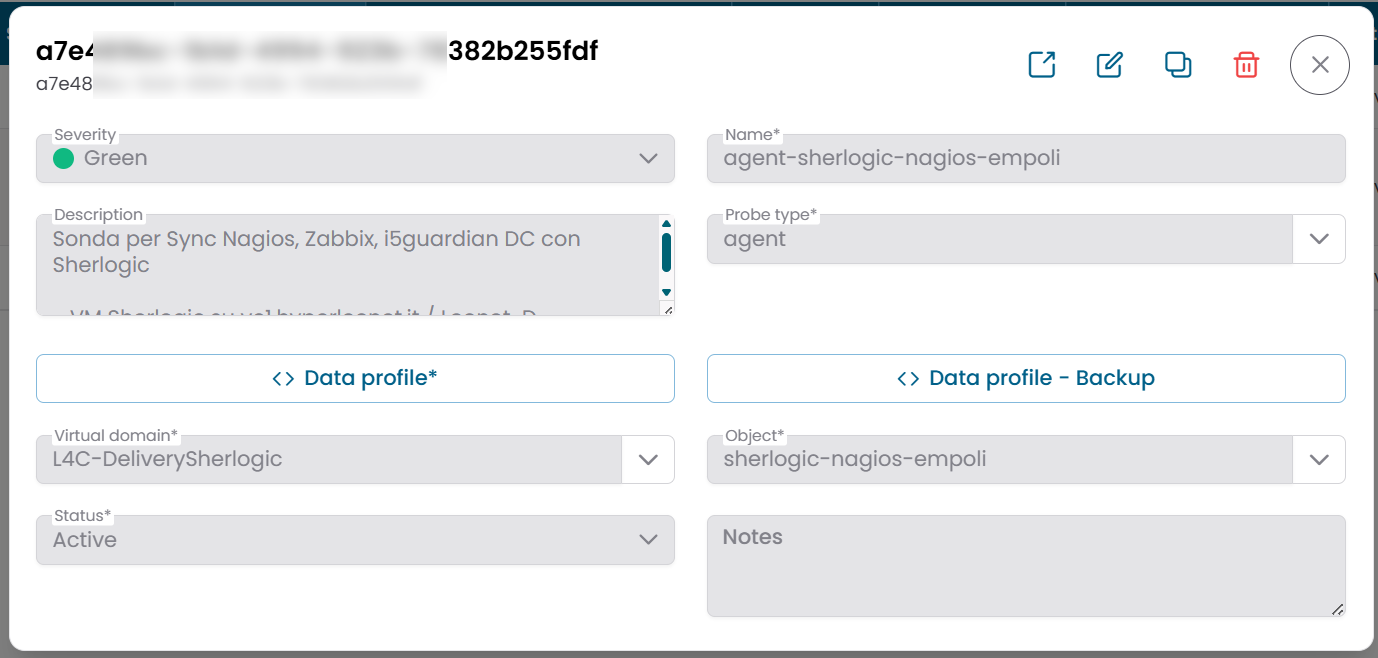
Fig.3 - Probe detail dialog
Probe Logs
Each probe provides access to a Logs view that records operational events and messages generated by the probe.
To open the logs, click the Logs action button on the probe row.
Use the logs to diagnose issues such as:
- connectivity problems between the probe and the monitored resource
- configuration errors
- data ingestion failures
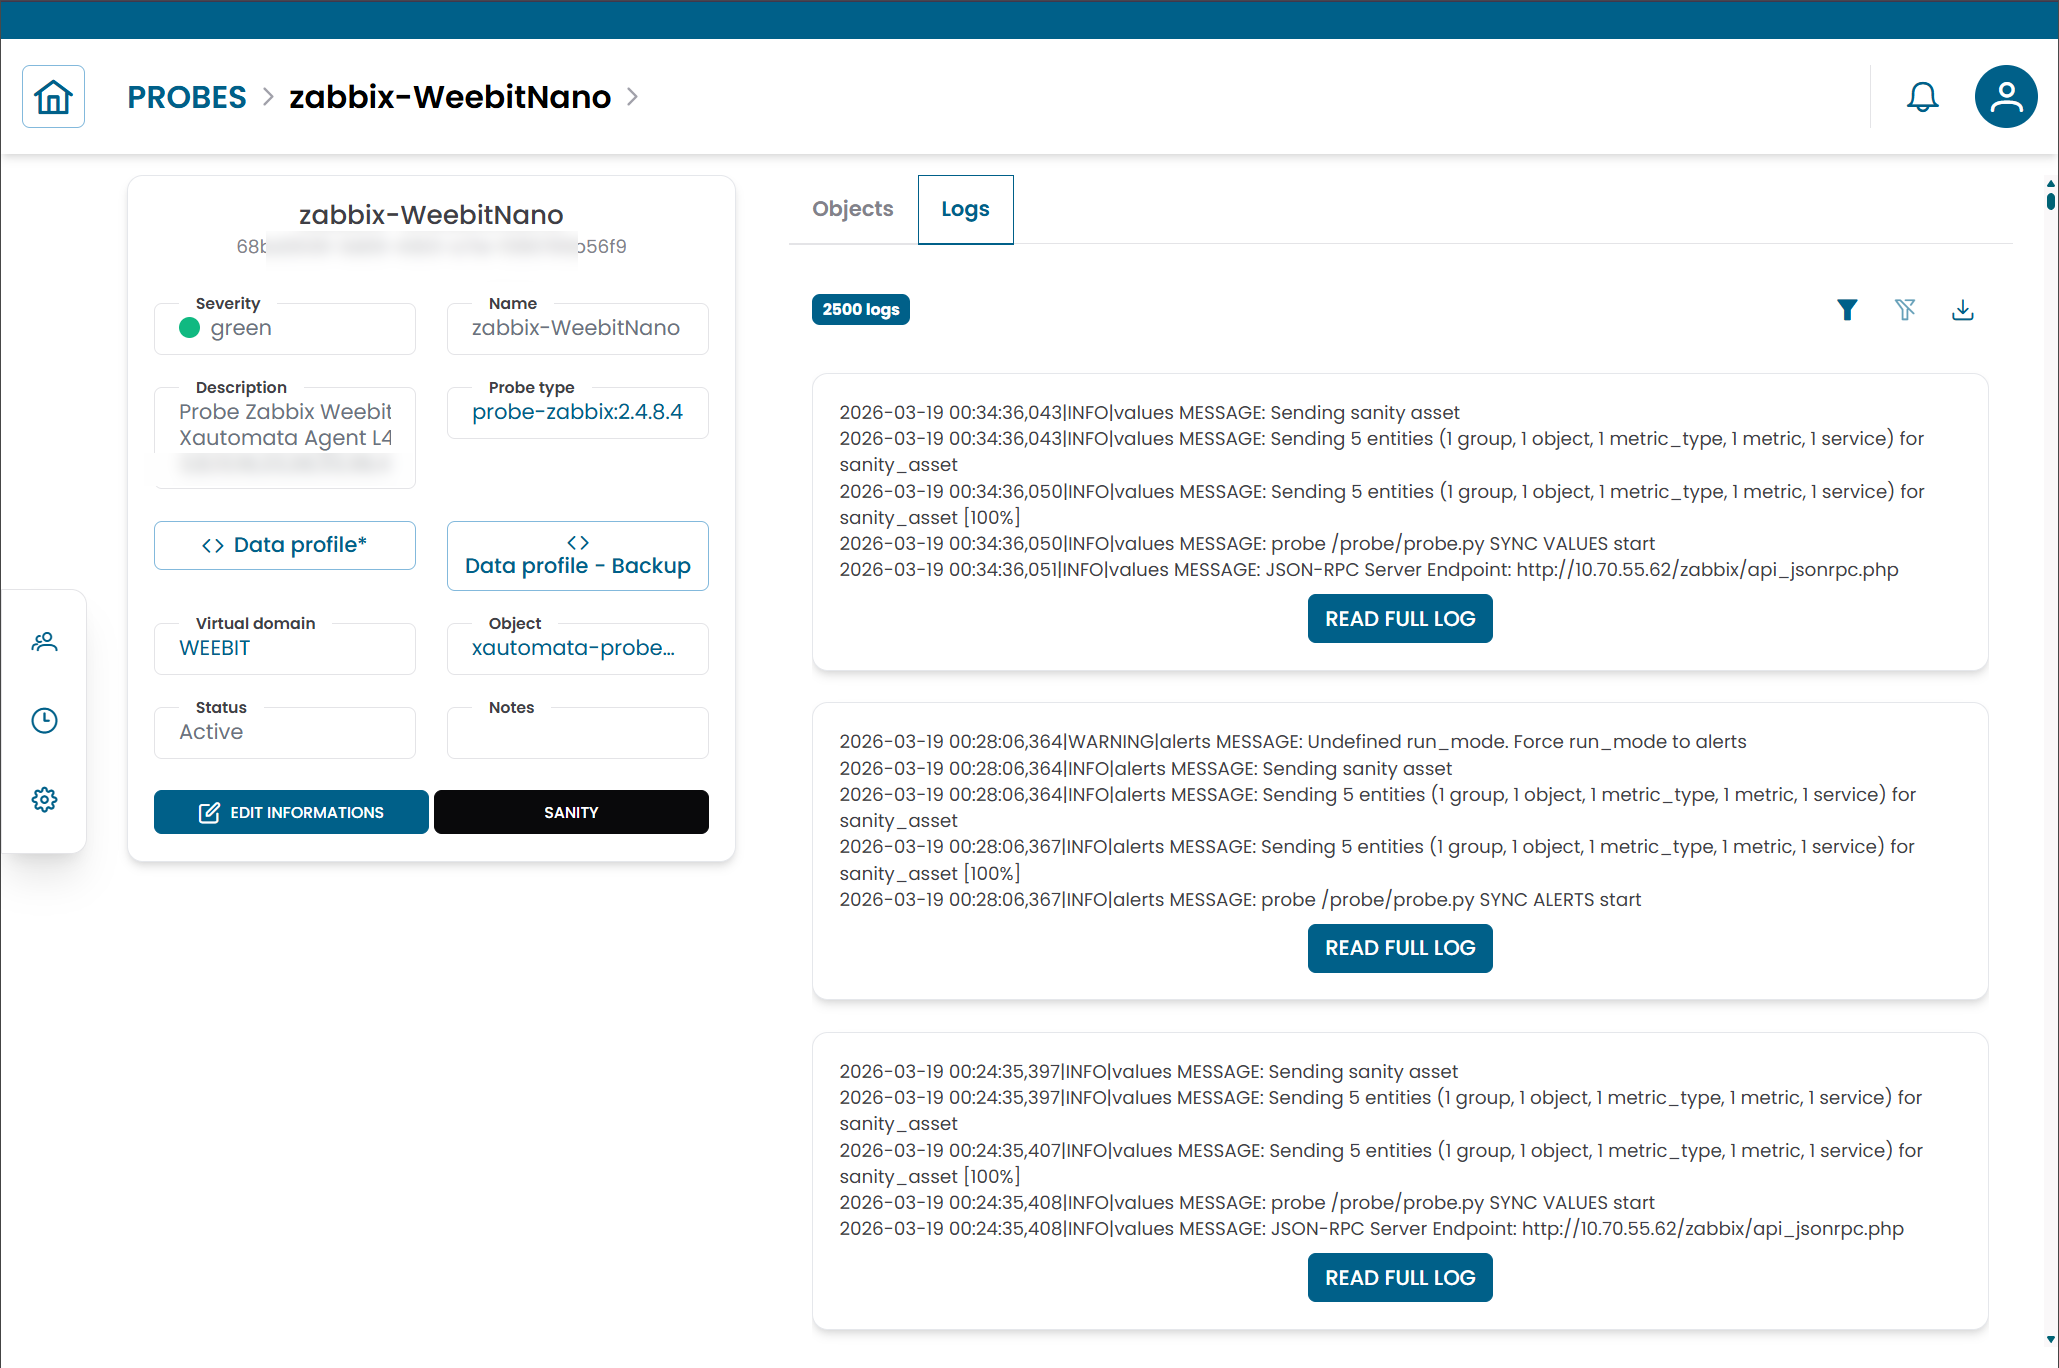
Fig.4 - Probe logs view
Connections View
Click the link icon (🔗) on any row to open the Connections View for that probe.
| Tab | Description |
|---|---|
| Objects | Infrastructure resources associated with this probe |
Use this view to link a probe to additional objects or to remove existing associations.
Note
Probe types define the monitoring technology used by a probe. See Probe Types for details. To understand how probes fit into the monitoring architecture, see Objects.