Services
The Services section manages logical service definitions used to represent and monitor business or operational services within XAUTOMATA. Services sit above the infrastructure layer — they aggregate metrics from objects and provide a service-level view of monitoring data.
Info
Services represent a logical monitoring layer. Unlike objects, they do not correspond directly to a physical resource — they group and interpret monitoring data in terms of a service or business function.
Opening the Services Section
From the main navigation menu, go to Customers → Objects Repository → Services.
The interface opens with a pre-filter dialog. Fill in one or more fields to narrow the search, then click APPLY.
| Filter field | Description |
|---|---|
| Name | Name of the service |
| Description | Optional description |
| Profile | Service classification |
| Customer | Customer the service belongs to |
| Service Parent | Parent service, for hierarchical services |
| Status | Active, Disabled, or Maintenance |
By default, the pre-filter is set to show only active services. Leave other fields empty and click APPLY to load all active services.
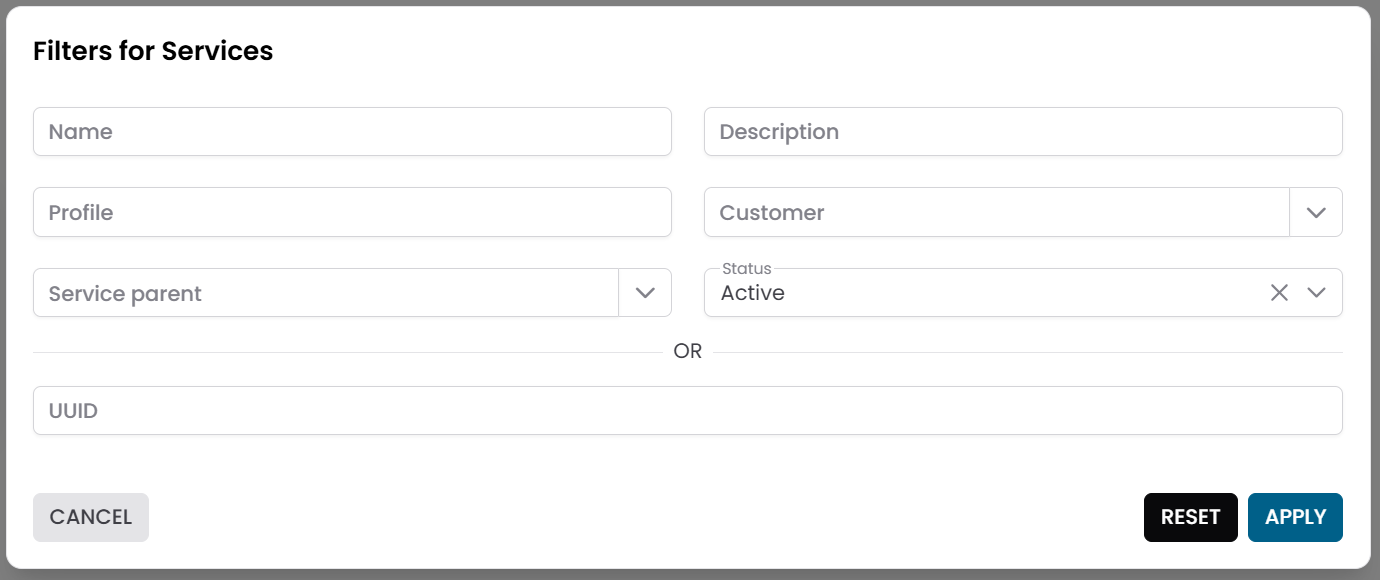
Fig.1 - Services pre-filter dialog
Services Table
After applying the filter, the results appear in a table where each row represents a service.
Typical columns include:
- Name
- Description
- Profile
- Status
The table supports multi-selection, which enables mass operations on multiple services at once.
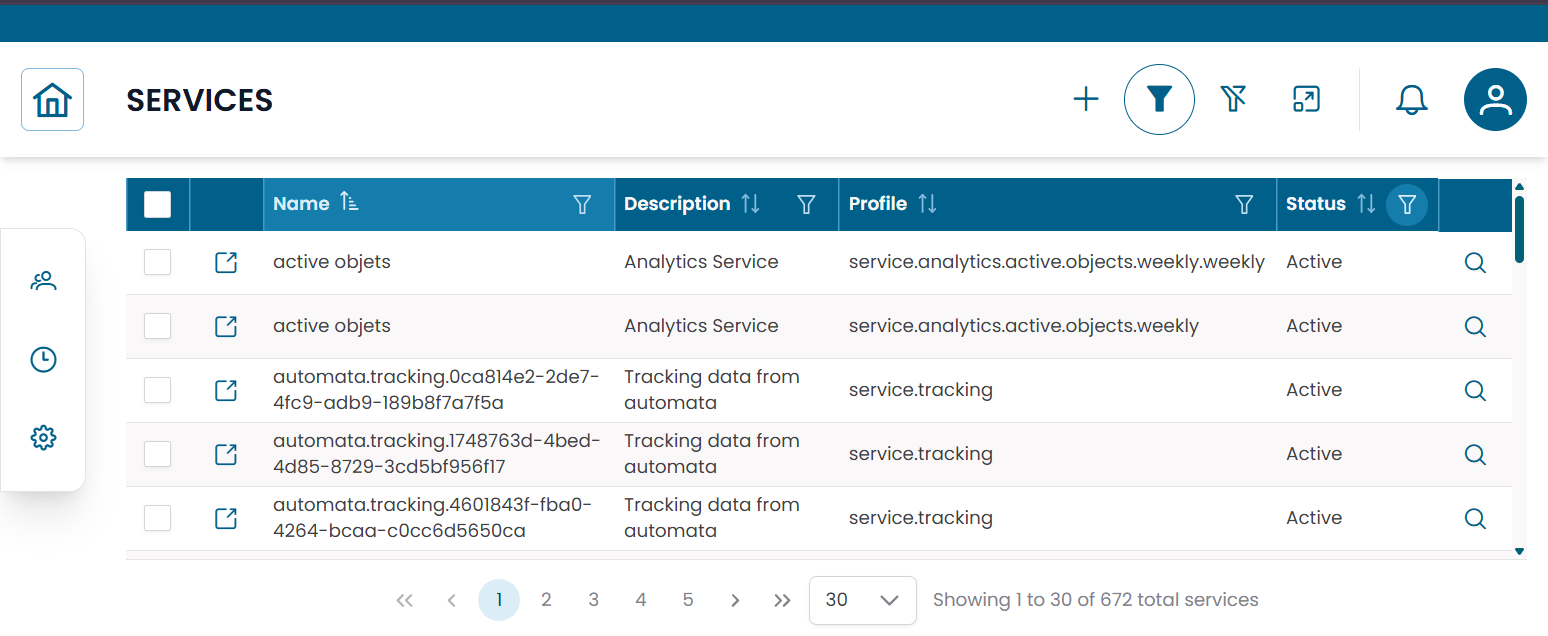
Fig.2 - Services results table
Service Details
Click the search icon (🔍) on any row to open the service record.
The CRUD dialog displays the full configuration of the service:
| Field | Description |
|---|---|
| Name | Name of the service |
| Description | Optional description |
| Profile | Service classification |
| Customer | Customer the service is associated with |
| Service Parent | Parent service, if this is a child service |
| Status | Active, Disabled, or Maintenance |
| Rule | JSON configuration used by the service logic |
| Automata | JSON configuration related to service automation |
From this dialog you can:
- edit the service configuration
- duplicate the record
- delete the record
Note
The Rule and Automata fields contain JSON-based configurations managed by the XAUTOMATA delivery team. Do not edit them unless instructed.
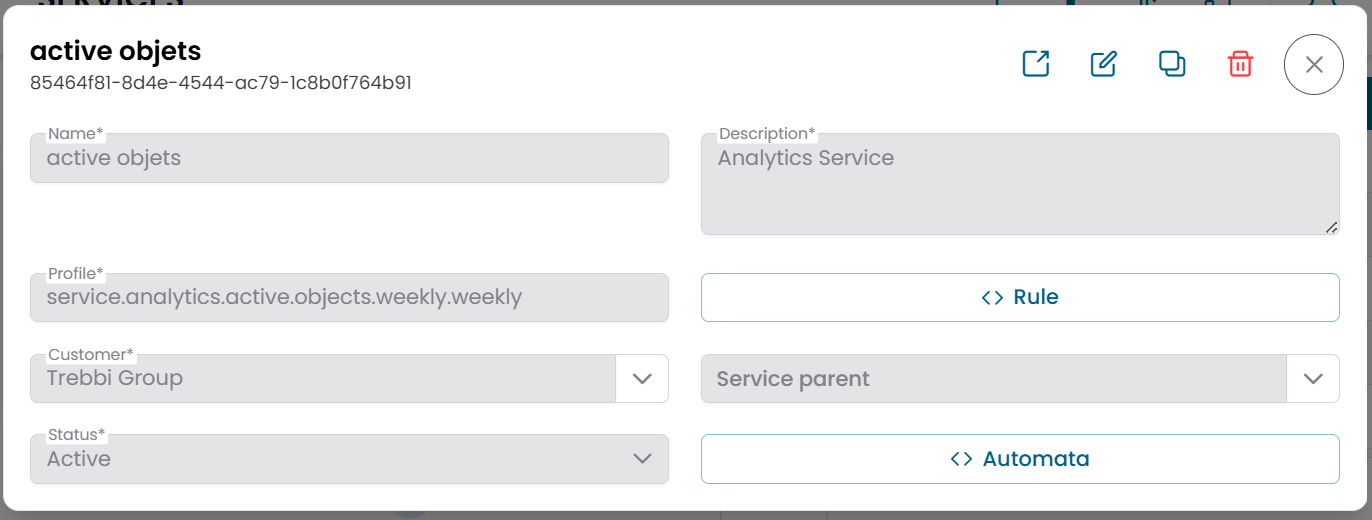
Fig.3 - Service detail dialog
Service Data
To inspect the monitoring data associated with a service, click Show Service Data on the service row.
This opens a dedicated view showing service-level analytics for the selected service.
When multiple services are selected in the table, use Multi-services data to compare data across services side by side.
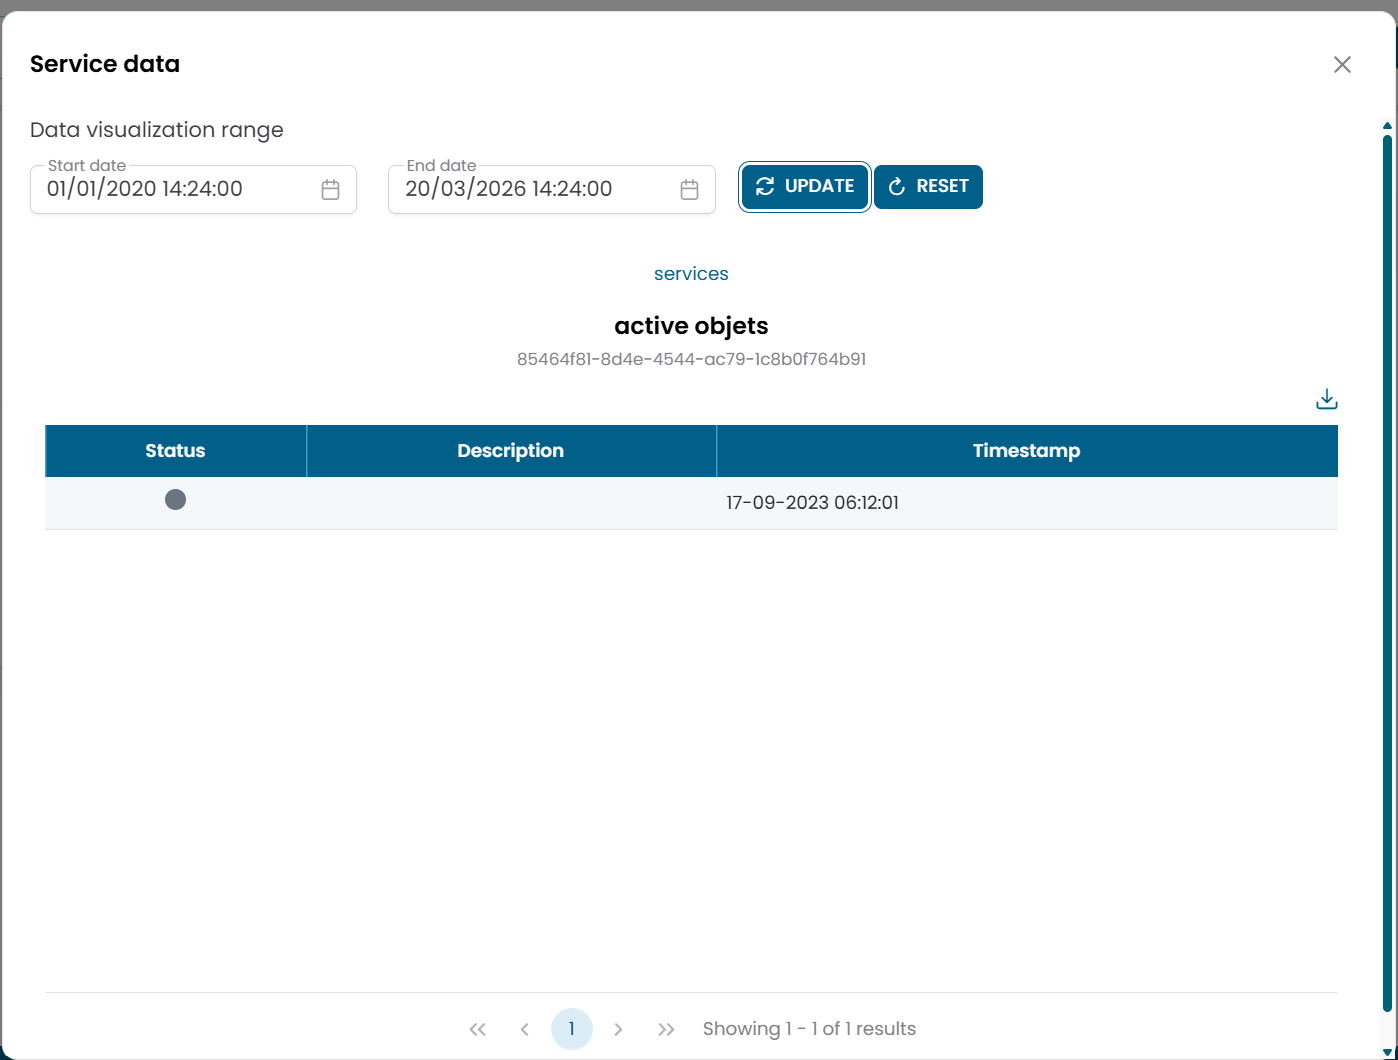
Fig.4 - Service Data view
Connections View
Click the link icon (🔗) on any row to open the Connections View for that service.
This is the main structural page for a service. It shows an information panel on the left and a tabbed area on the right with the following tabs:
| Tab | Description |
|---|---|
| Metrics | Metrics associated with this service |
| Services | Child services nested under this service |
| Downtimes | Active maintenance windows for this service |
| Dispatchers | Active automation rules linked to this service |
Metrics tab
Shows the metrics linked to the service. For each metric you can open Metric Data directly from this context to inspect the historical values.
Services tab
Shows child services nested under this service. You can create new child services directly from this tab — the parent relation is pre-filled automatically.
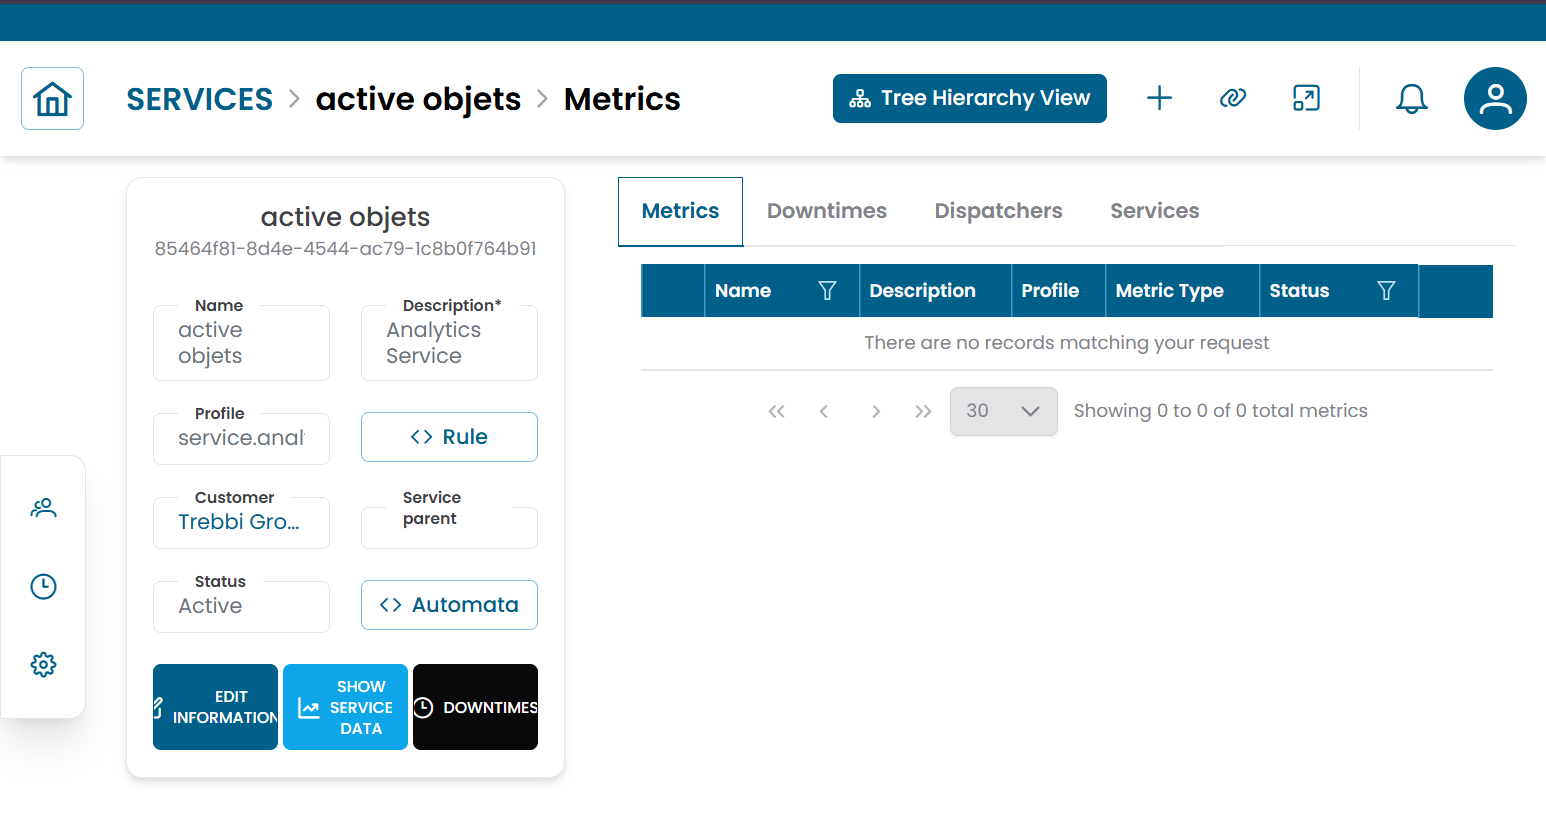
Fig.5 - Service connections view
Service Hierarchy View
From the Connections View, click Tree Hierarchy to switch to the Service Hierarchy View.
This view shows the selected service expanded through its child services, allowing you to navigate multi-level service structures.
Note
Unlike the infrastructure hierarchy (Group → Object → Metric Type → Metric), the service hierarchy expands through child services only, not through objects or metrics directly.
For more details on the Tree Hierarchy View, see Tree Hierarchy View.
Operational Actions
From the services table or the hierarchy view you can apply the following actions:
| Action | Description |
|---|---|
| Show Service Data | Open the service-level analytics view |
| Downtime | Temporarily suspend monitoring alerts for this service |
| Dispatcher | Configure an automated response triggered by this service's conditions |
For multiple services, use the mass operations:
- Massive Downtime
- Massive Dispatcher
- Multi-services data