Metric Types
The Metric Types section defines the measurements collected from monitored objects. Each metric type represents a specific monitoring dimension — for example CPU usage, network latency, or service availability — and acts as the template from which actual metric values are recorded over time.
Info
A metric type defines what is measured. The actual measured values are stored as Metrics.
Opening the Metric Types Section
From the main navigation menu, go to Customers → Objects Repository → Metric Types.
The interface opens with a pre-filter dialog. Fill in one or more fields to narrow the search, then click APPLY.
| Filter field | Description |
|---|---|
| Name | Name of the metric type |
| Description | Optional description |
| Profile | Classification of the measurement |
| Object | Object the metric type belongs to |
| Status | Active or Disabled |
By default, the pre-filter is set to show only active metric types. Leave other fields empty and click APPLY to load all active metric types.
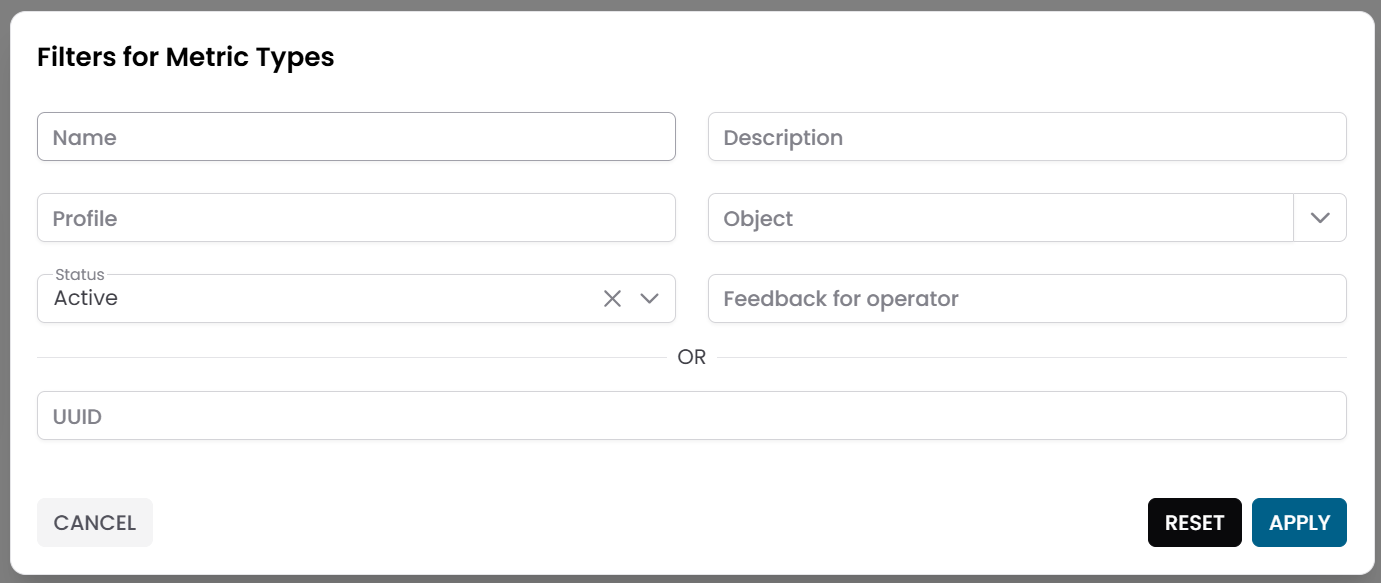
Fig.1 - Metric Types pre-filter dialog
Metric Types Table
After applying the filter, the results appear in a table where each row represents a metric type.
Typical columns include:
- Name
- Description
- Profile
- Object
- Status
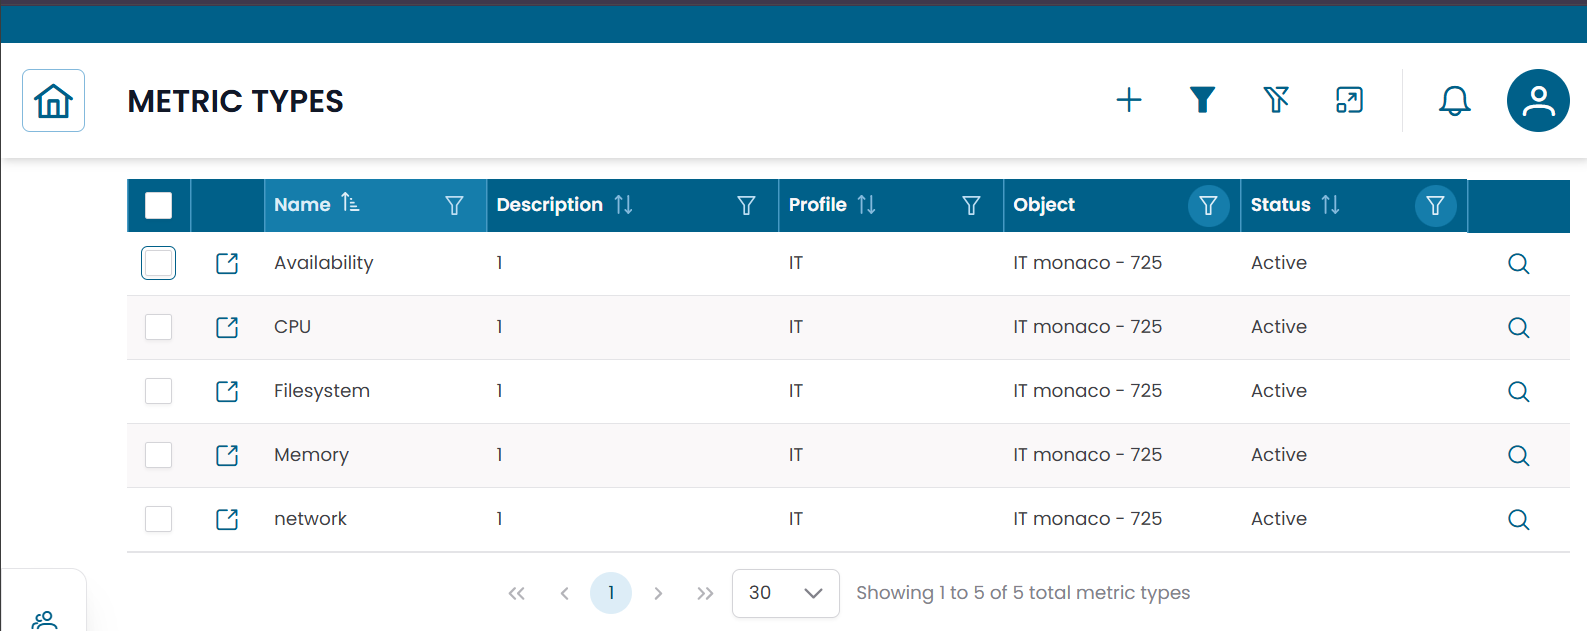
Fig.2 - Metric Types results table
Metric Type Details
Click the search icon (🔍) on any row to open the metric type record.
The CRUD dialog displays the full configuration:
| Field | Description |
|---|---|
| Name | Name of the metric type |
| Description | Optional description |
| Profile | Classification of the measurement |
| Object | Object this metric type is associated with |
| Data Profile | JSON configuration for the metric type |
| Automata Domain | Automation scope |
| Status | Active or Disabled |
| Feedback for Operator | Notes or guidance for the operator |
From this dialog you can:
- edit the metric type configuration
- duplicate the record
- delete the record
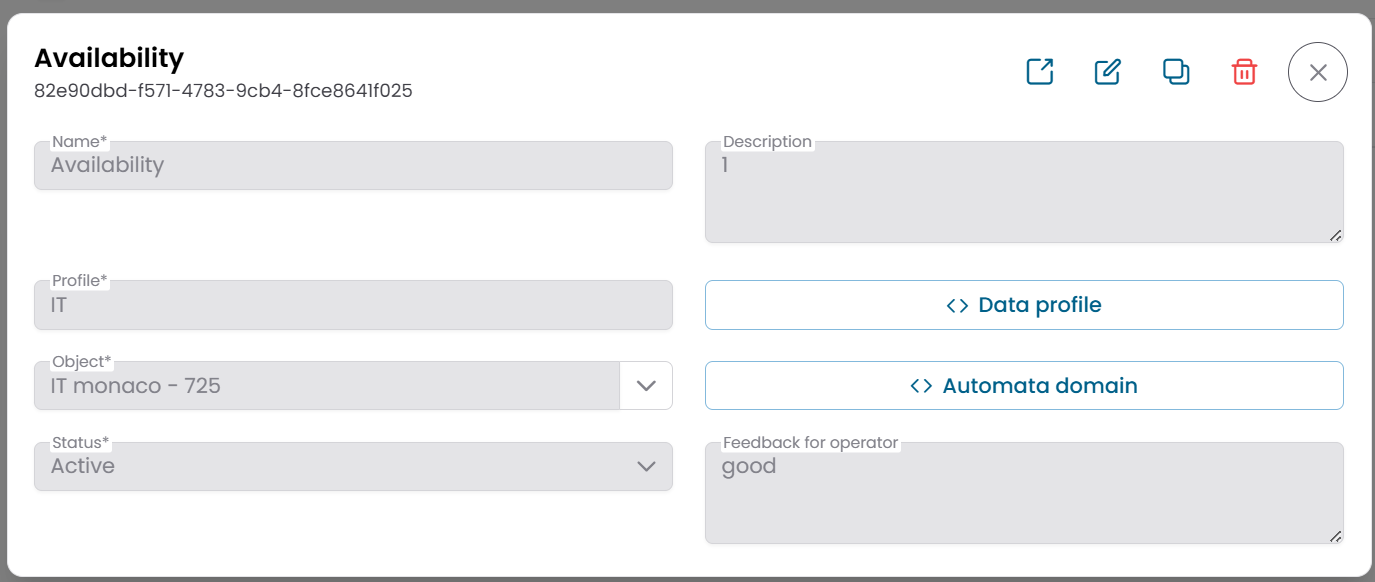
Fig.3 - Metric Type detail dialog
Metric Type Structure View
Click the link icon (🔗) on any row to open the Metric Type Structure View.
The page is divided into two areas:
- a metric type information panel on the left
- a hierarchical navigation area on the right
The hierarchy displays the metrics associated with this metric type — the actual time-series values collected from the monitored object.
Use this view to inspect individual metric records and apply operational actions directly from the hierarchy.
For a detailed explanation of how to use this view, see Tree Hierarchy View.
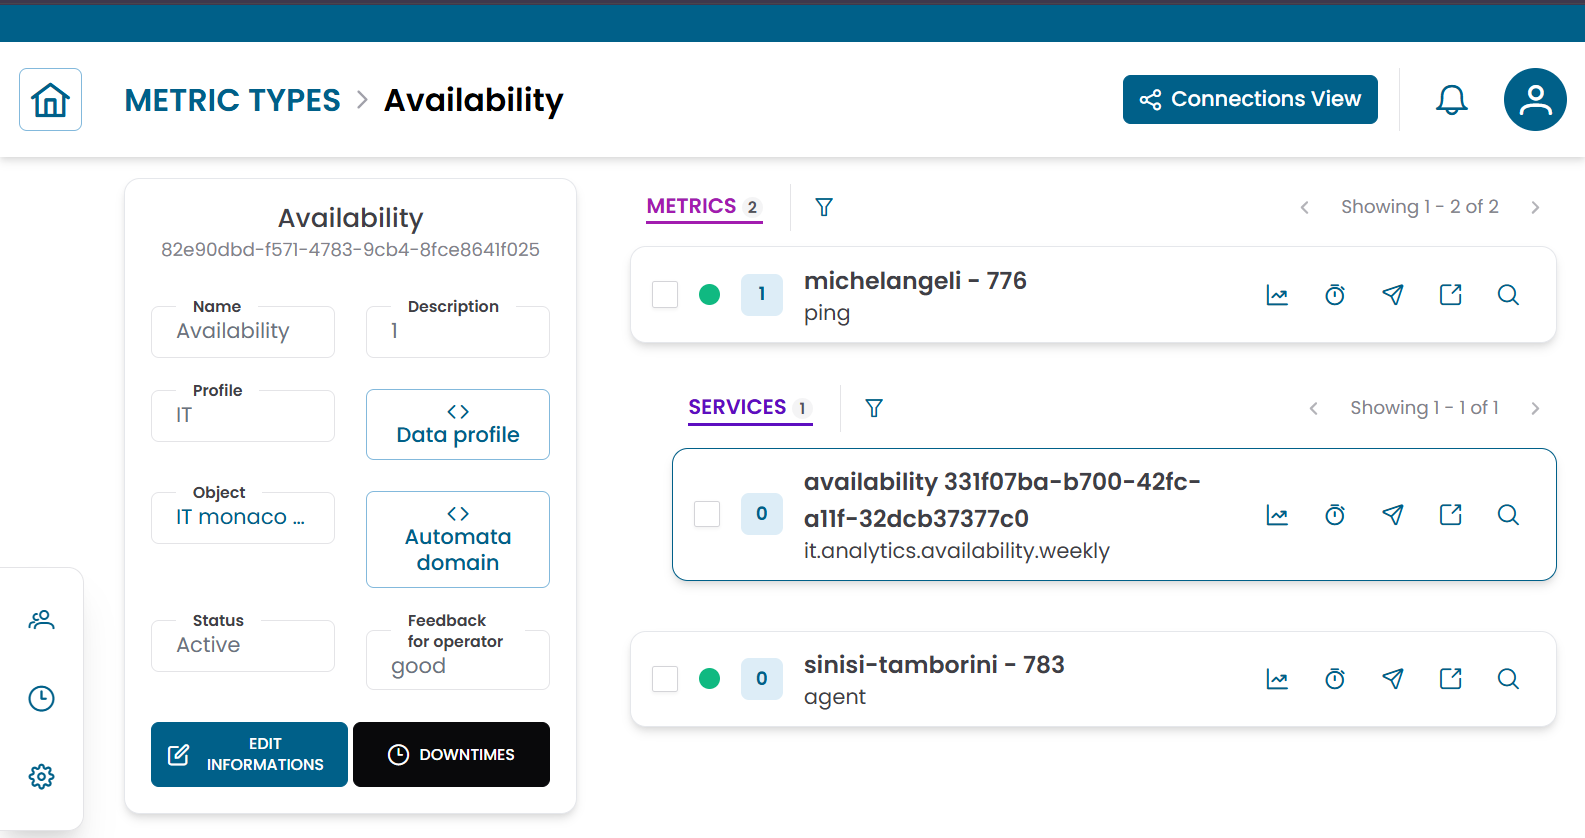
Fig.4 - Metric Type structure view
Operational actions
From the hierarchy view you can apply the following actions to metrics:
| Action | Description |
|---|---|
| Metric Data | Open the historical chart or table for the selected metric |
| Downtime | Temporarily suspend monitoring alerts for the selected metric |
| Dispatcher | Configure an automated response triggered by a monitoring event |
Metric types also support mass operations — select multiple metrics in the tree and apply a single action to all of them:
- Massive Downtime
- Massive Dispatcher
Connections View
From the Metric Type Structure View, click Connections to switch to the Connections View.
This view shows the entities linked to the metric type:
| Tab | Description |
|---|---|
| Metrics | Time-series records associated with this metric type |
| Downtimes | Active maintenance windows for this metric type |
| Dispatchers | Active automation rules linked to this metric type |
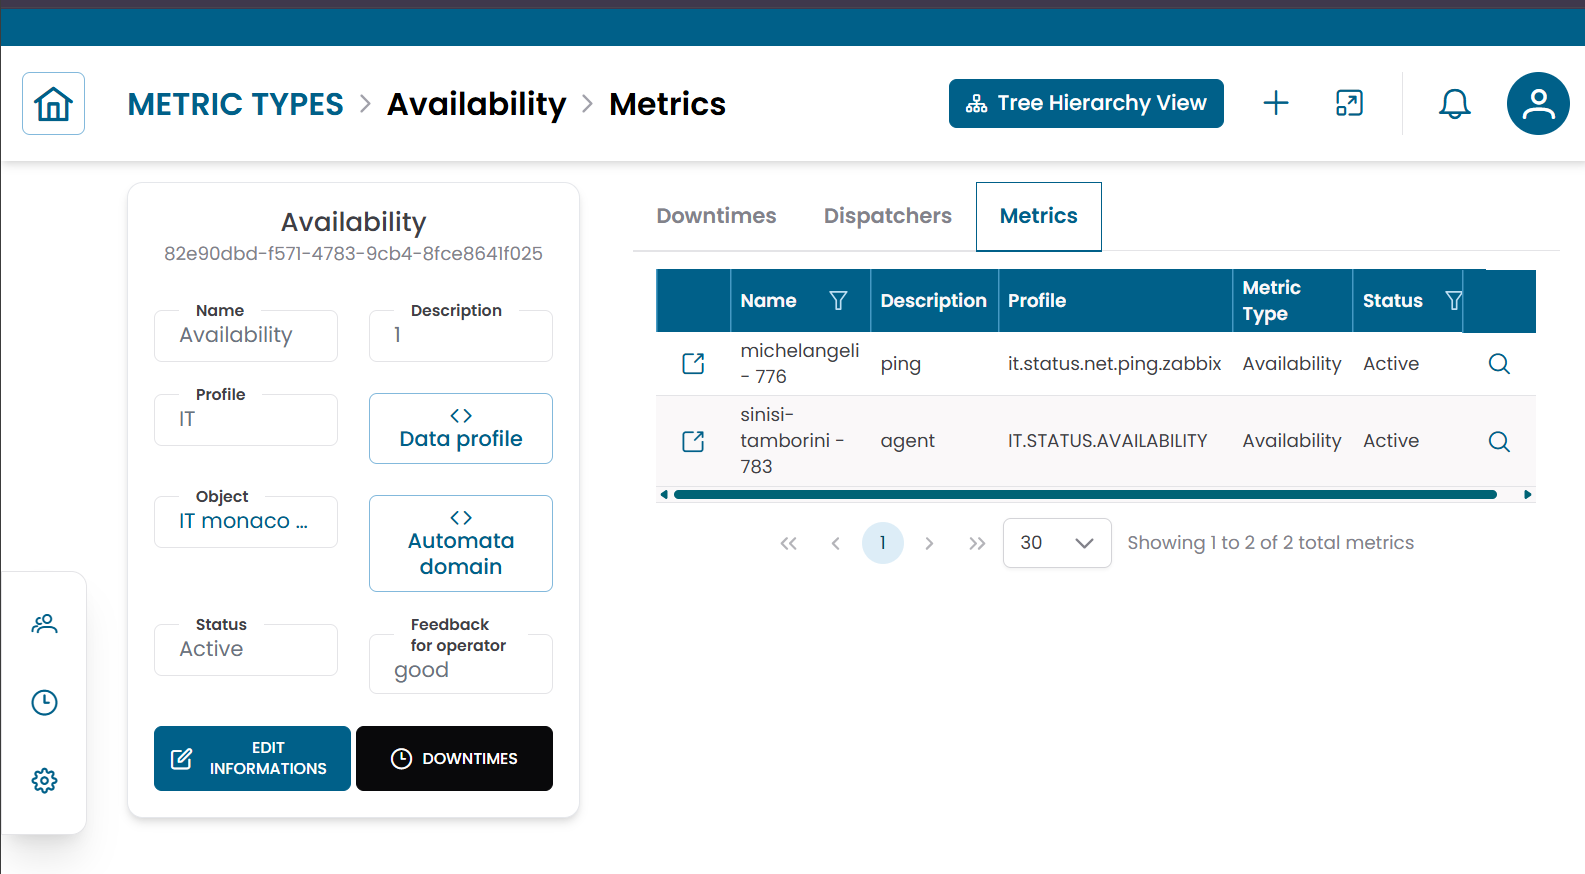
Fig.5 - Metric Type connections view